2023 Drupal Local Development Survey Results
The Drupal Local Development Survey asks Drupal devs all over the world about the tools and processes they use when building amazing Drupal sites. It provides a fascinating insight into how Drupal sites get built and the people that build them. It also helps web hosts and Drupal tool developers understand their users in more detail, so that they can build even better solutions.
The survey was previously run by Jeff Geerling and Chris Urban from 2018 to 2020, but has been on a break since. In 2023 it's back, and has had a really amazing response. Read on for the results!
How it began
Chris and Jeff are both ex-Acquia, but sadly don’t work with Drupal anymore so the survey didn’t happen in 2021 and 2022. Chris has moved on to program management at Confluent, who provides a managed Kafka service, and Jeff is a full time Youtuber with nearly half a million subscribers, focused on Raspberry Pis.

These surveys focus on asking Drupal developers all over the world about the tools, hosts, and processes they use to build great Drupal sites. As we are a team who builds tools for Drupal and host Drupal websites, we found the data from these surveys really meaningful and helpful.
This is why earlier this year we reached out to Chris and Jeff to ask if they were planning another iteration, and sadly, they weren’t. We asked if we could take over and was graciously given permission to do so.
So, before we get stuck in, we want to very sincerely thank both Jeff and Chris for their previous work on this project, and for allowing us to take it forward in years to come.
Thanks to our translators
The survey was also translated into 3 other languages for the first time. Drupal is a very English-centric tool and we felt it was important to reach out to developers in their native language as much as possible.

It takes a fair bit of effort to put together a translation, and we want to thank Chris, Marine, and our own Jimmy Cann for volunteering their own time to help translate the survey into Traditional Chinese, French, and Japanese. Hopefully, next year we’ll be able to offer even more translations.
Who responded?
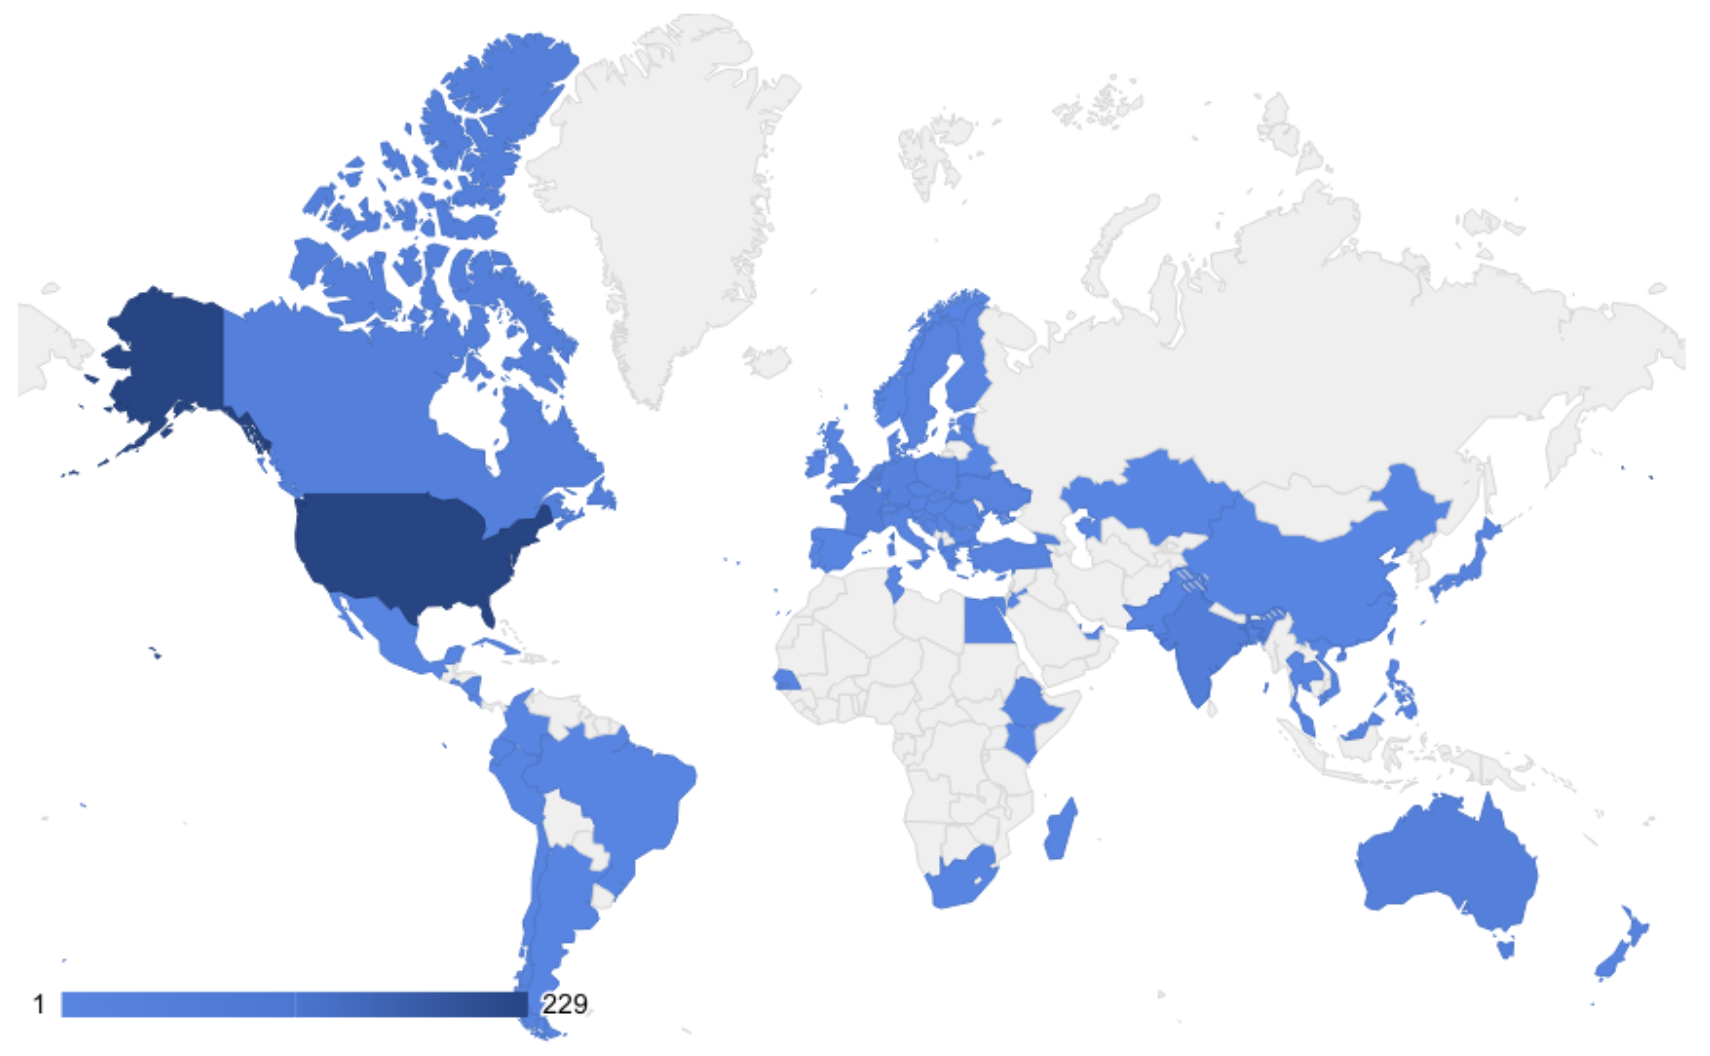
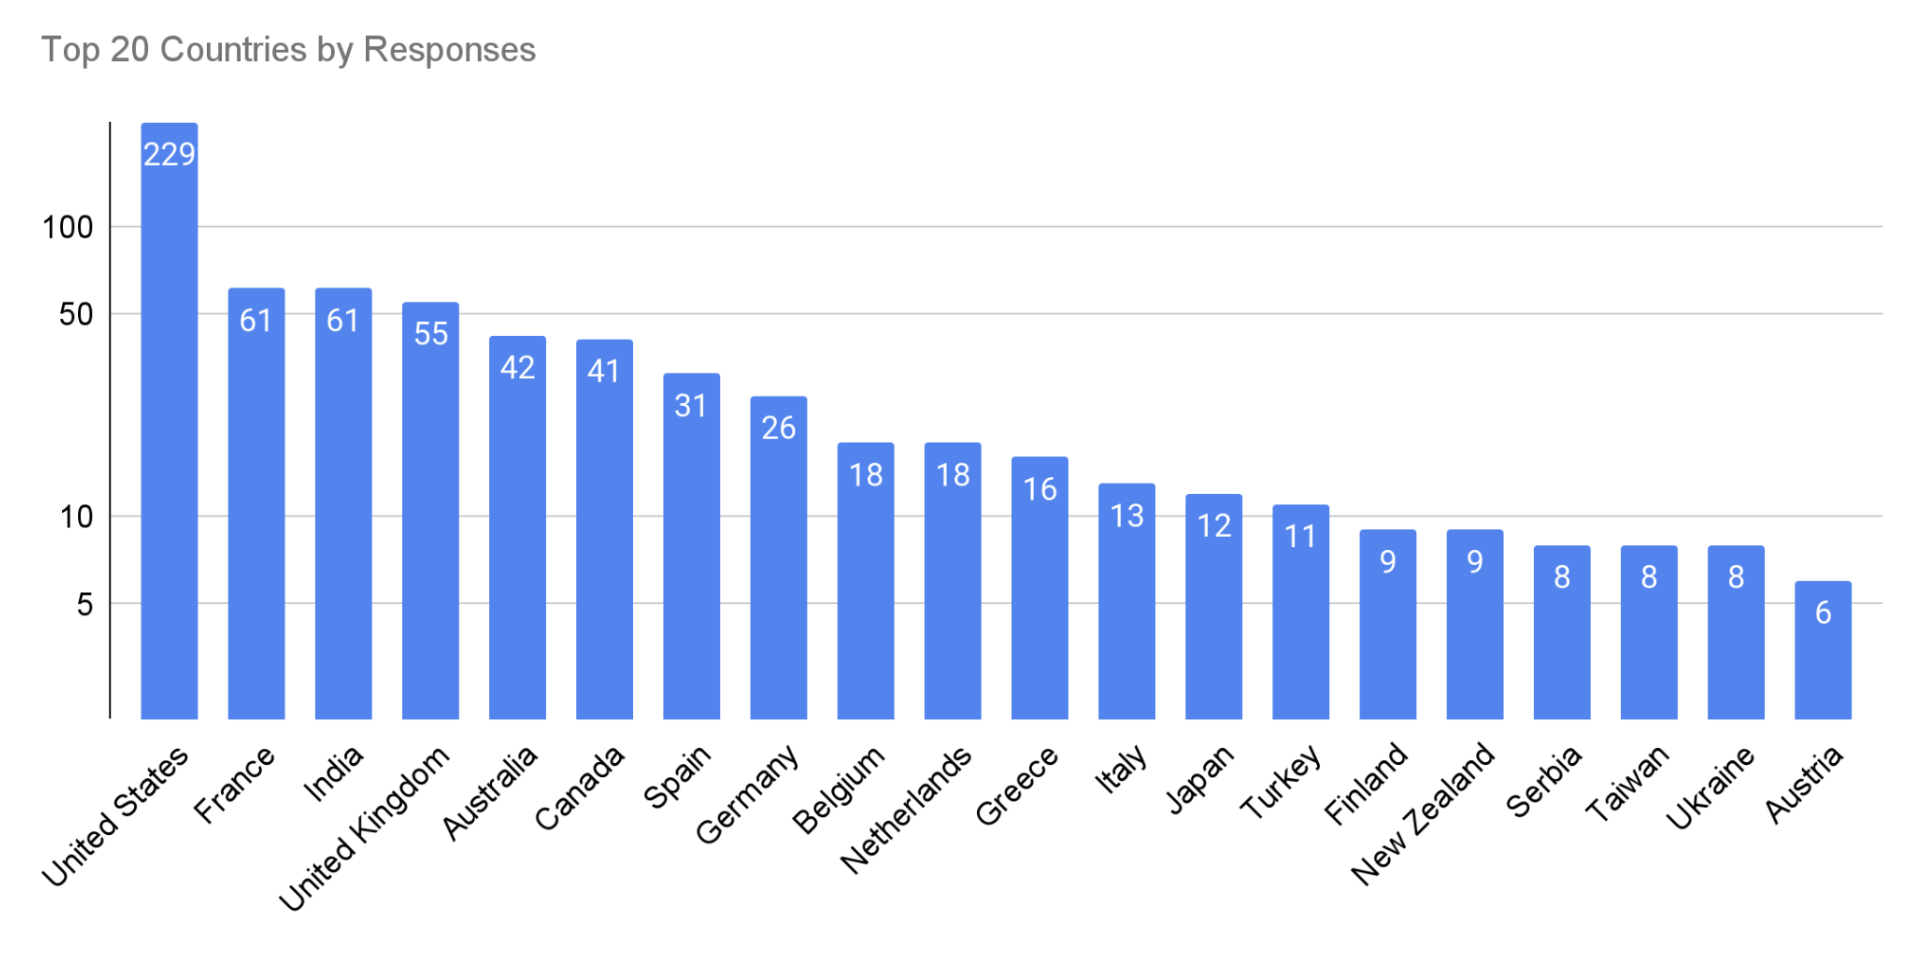
In 2023, we received 829 responses from 96 different countries. We had responses from places like Ethiopia, Albania, Costa Rica, Vietnam, and Cuba, as well as many of the countries you’d expect to see.
We were delighted when we received the first hundred responses, because we felt we needed at least that amount for some statistically significant results. But the final number of responses were beyond our wildest expectations. That was helped by a lot of people sharing it on social media, including the Drupal Association, Acquia, Platform.sh, Amazee, the developers of Lando and DDEV, and many, many more.
The number of responses is pretty consistent with previous years, so our sincere thanks to everyone who helped spread the word, and of course to the 829 people who took the time to fill out the survey and share their insights.
Team Size and Composition
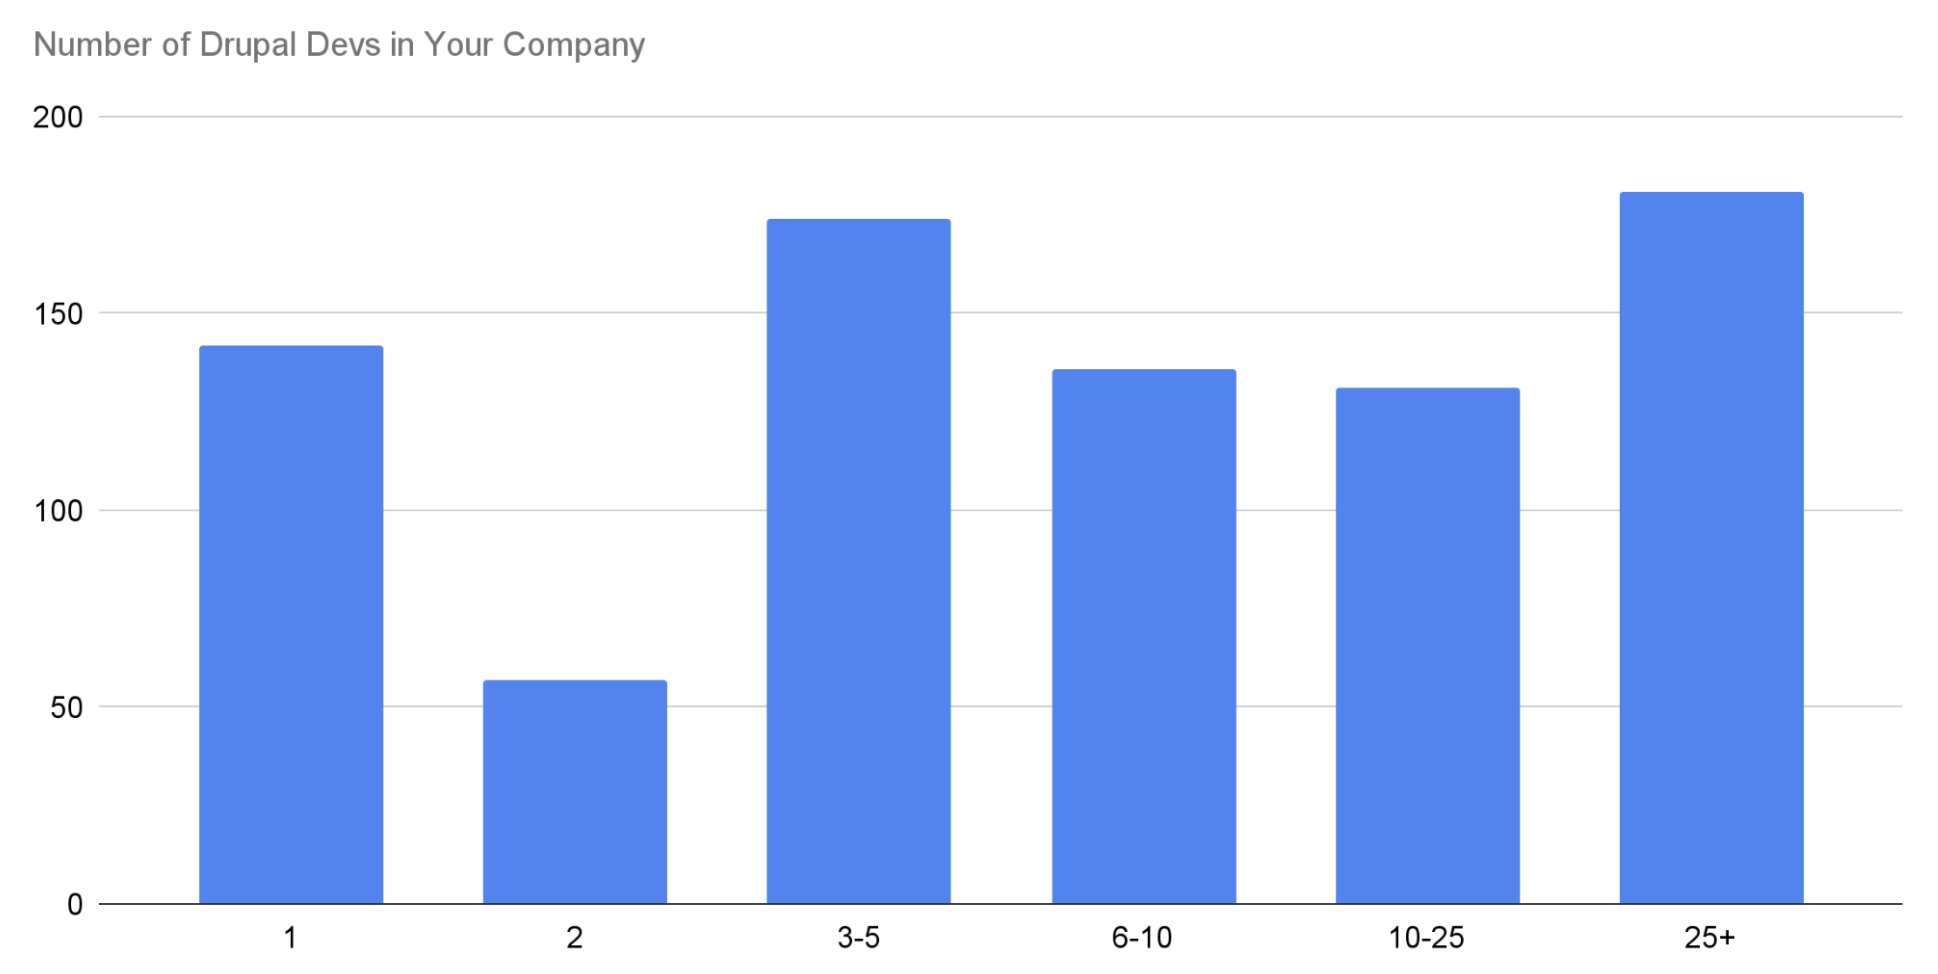
We asked respondents, “Including yourself, how many Drupal developers are in your current company?”. This was to gauge how many large organisations are working with Drupal, and what proportion of Drupal devs are working in smaller companies or even on their own.
The results are consistent with what we might expect….
Local Development Environment Managers
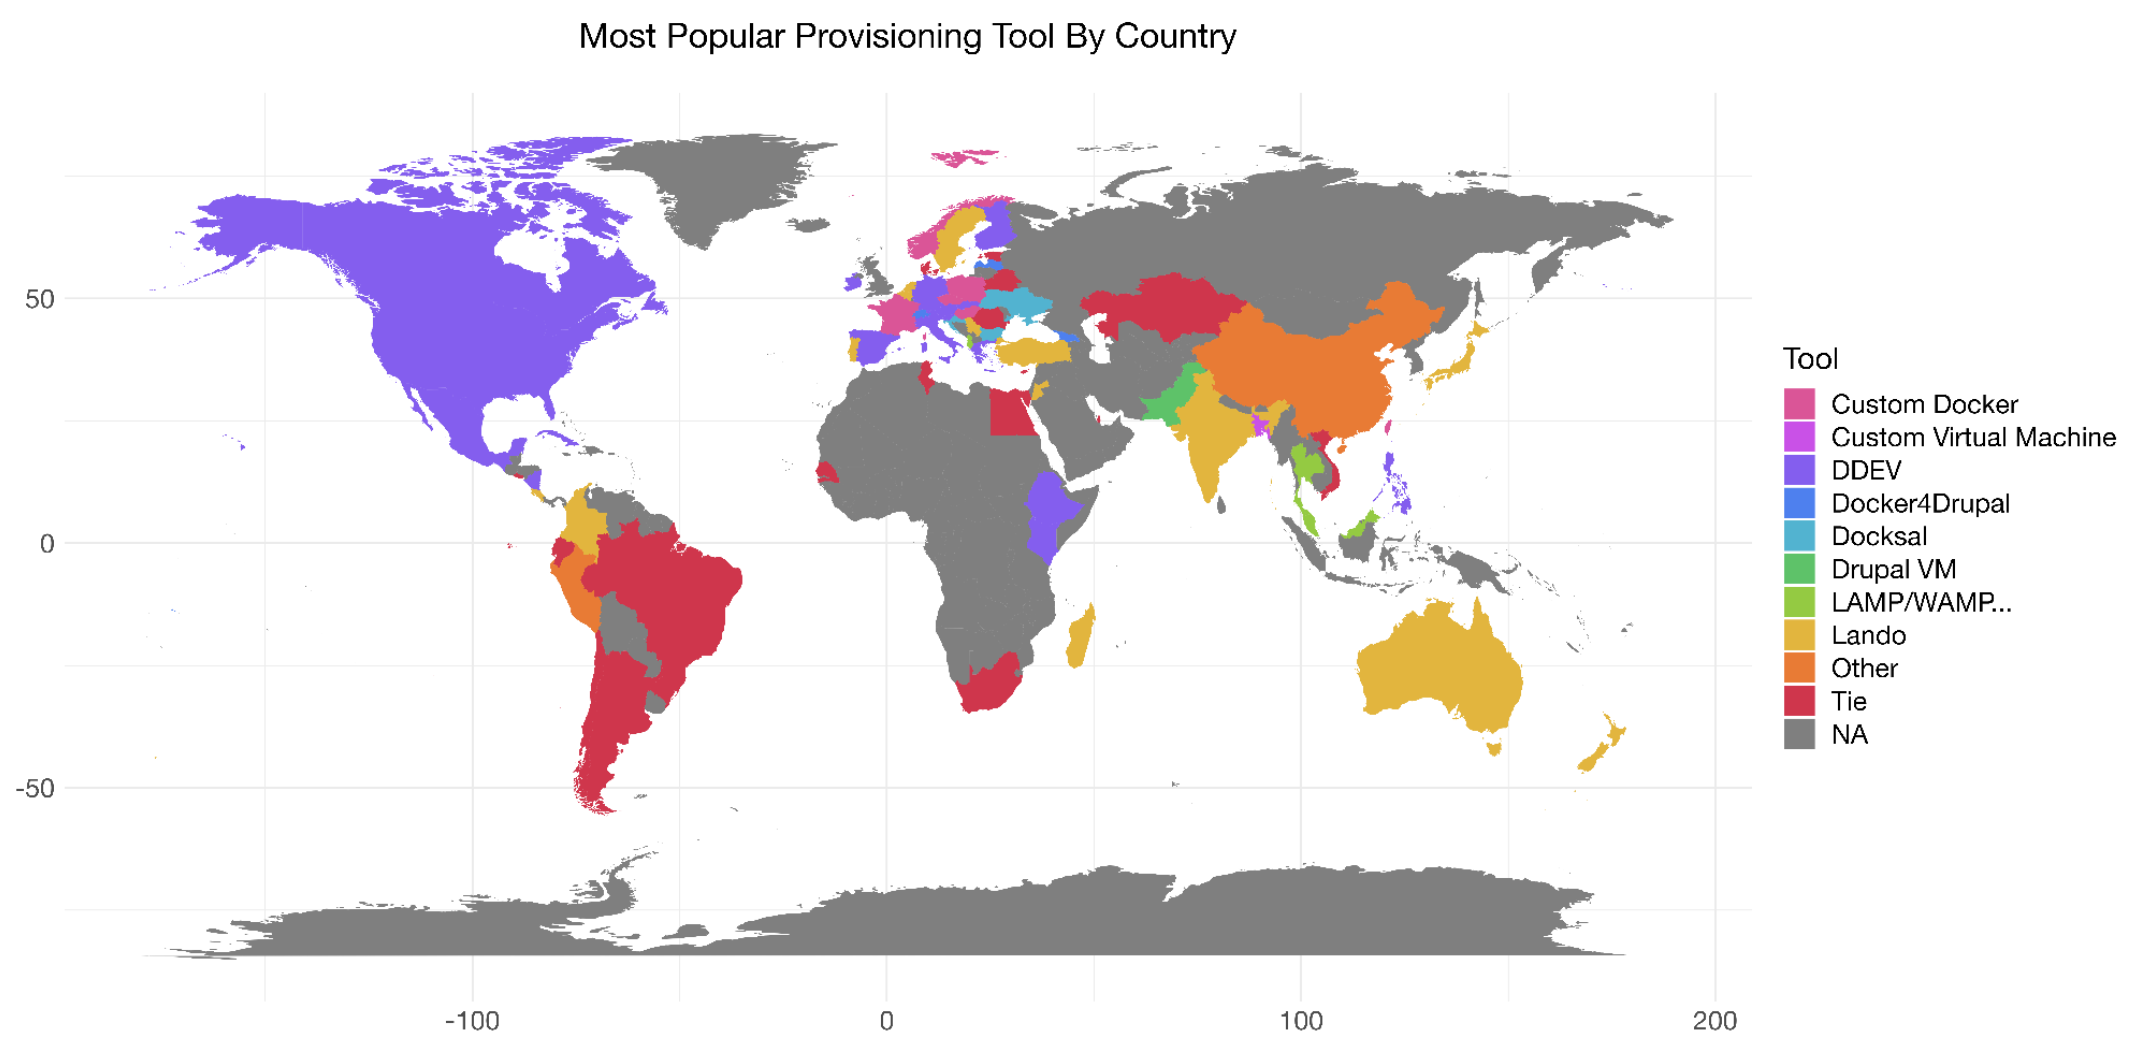
We asked developers which tools they used to provision and manage their local development environments. As you might expect, Lando and DDEV featured heavily. We were initially surprised to see DDEV win out overall, as among our customers (which are primarily in Australia and New Zealand) we see a lot more Lando than DDEV.
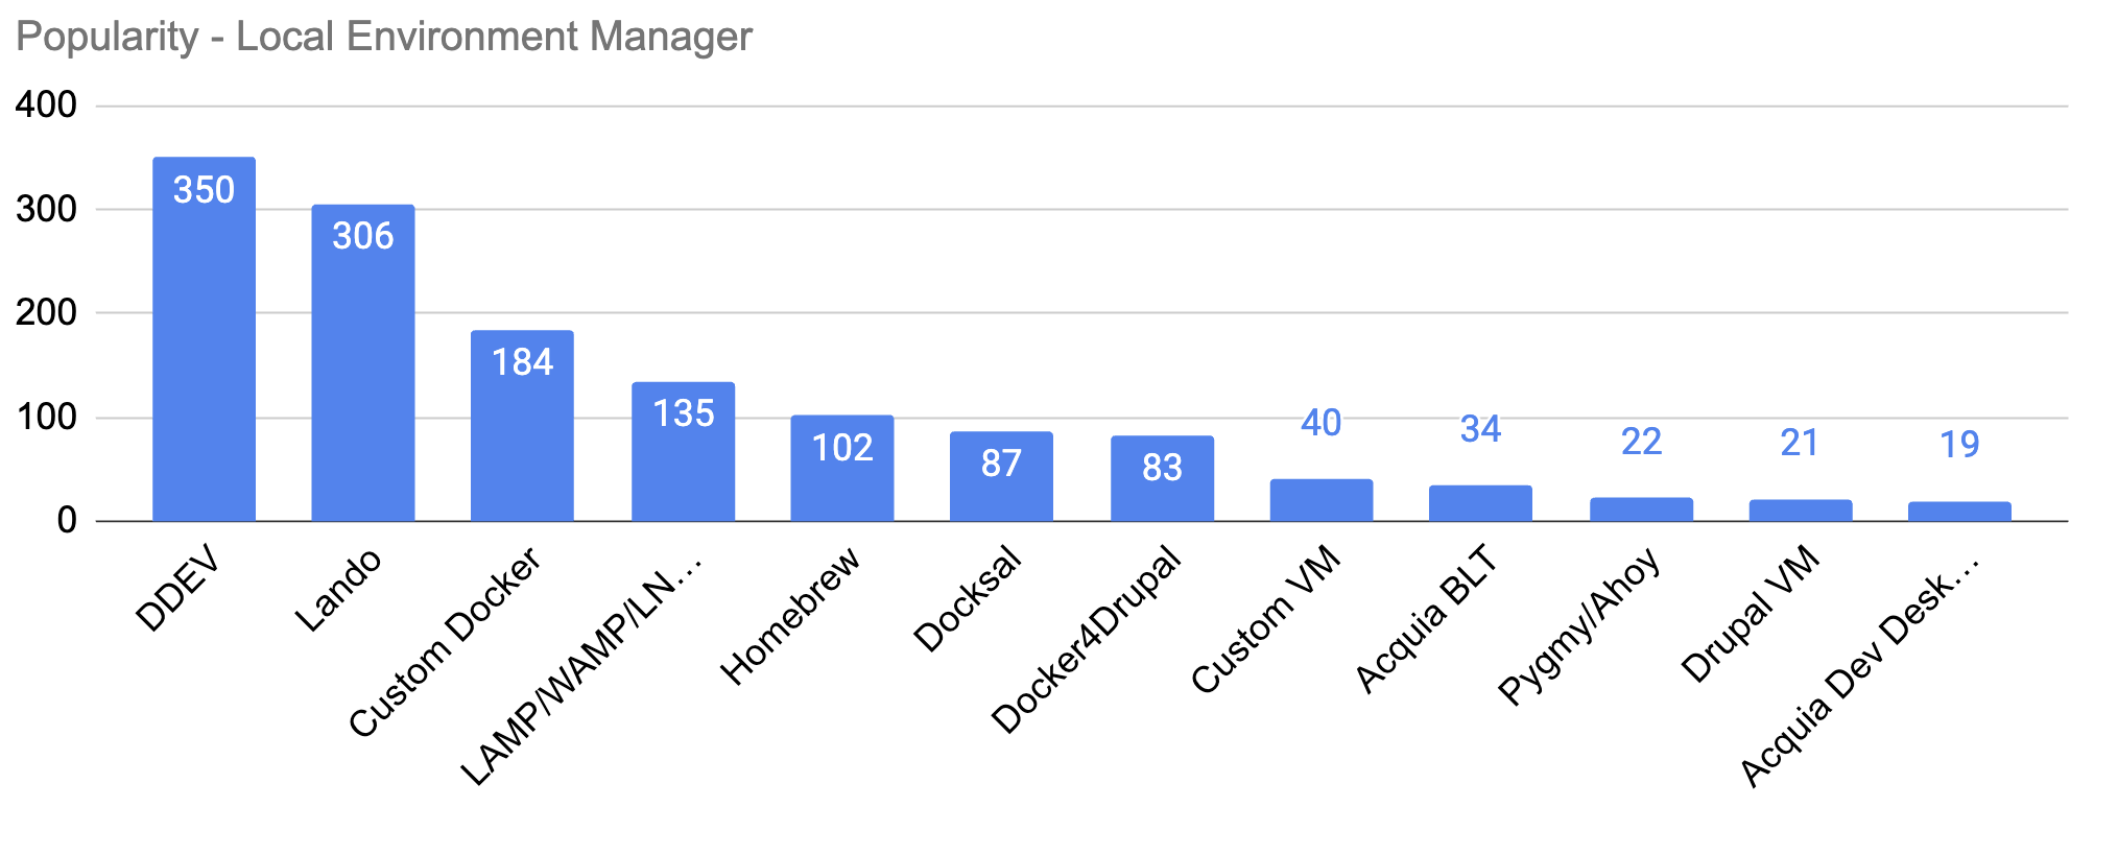
And that’s somewhat backed up by the data when we look at popularity by country. We can see that Lando is more popular within Australia and New Zealand, while DDEV is more popular in North America and quite a few European countries.
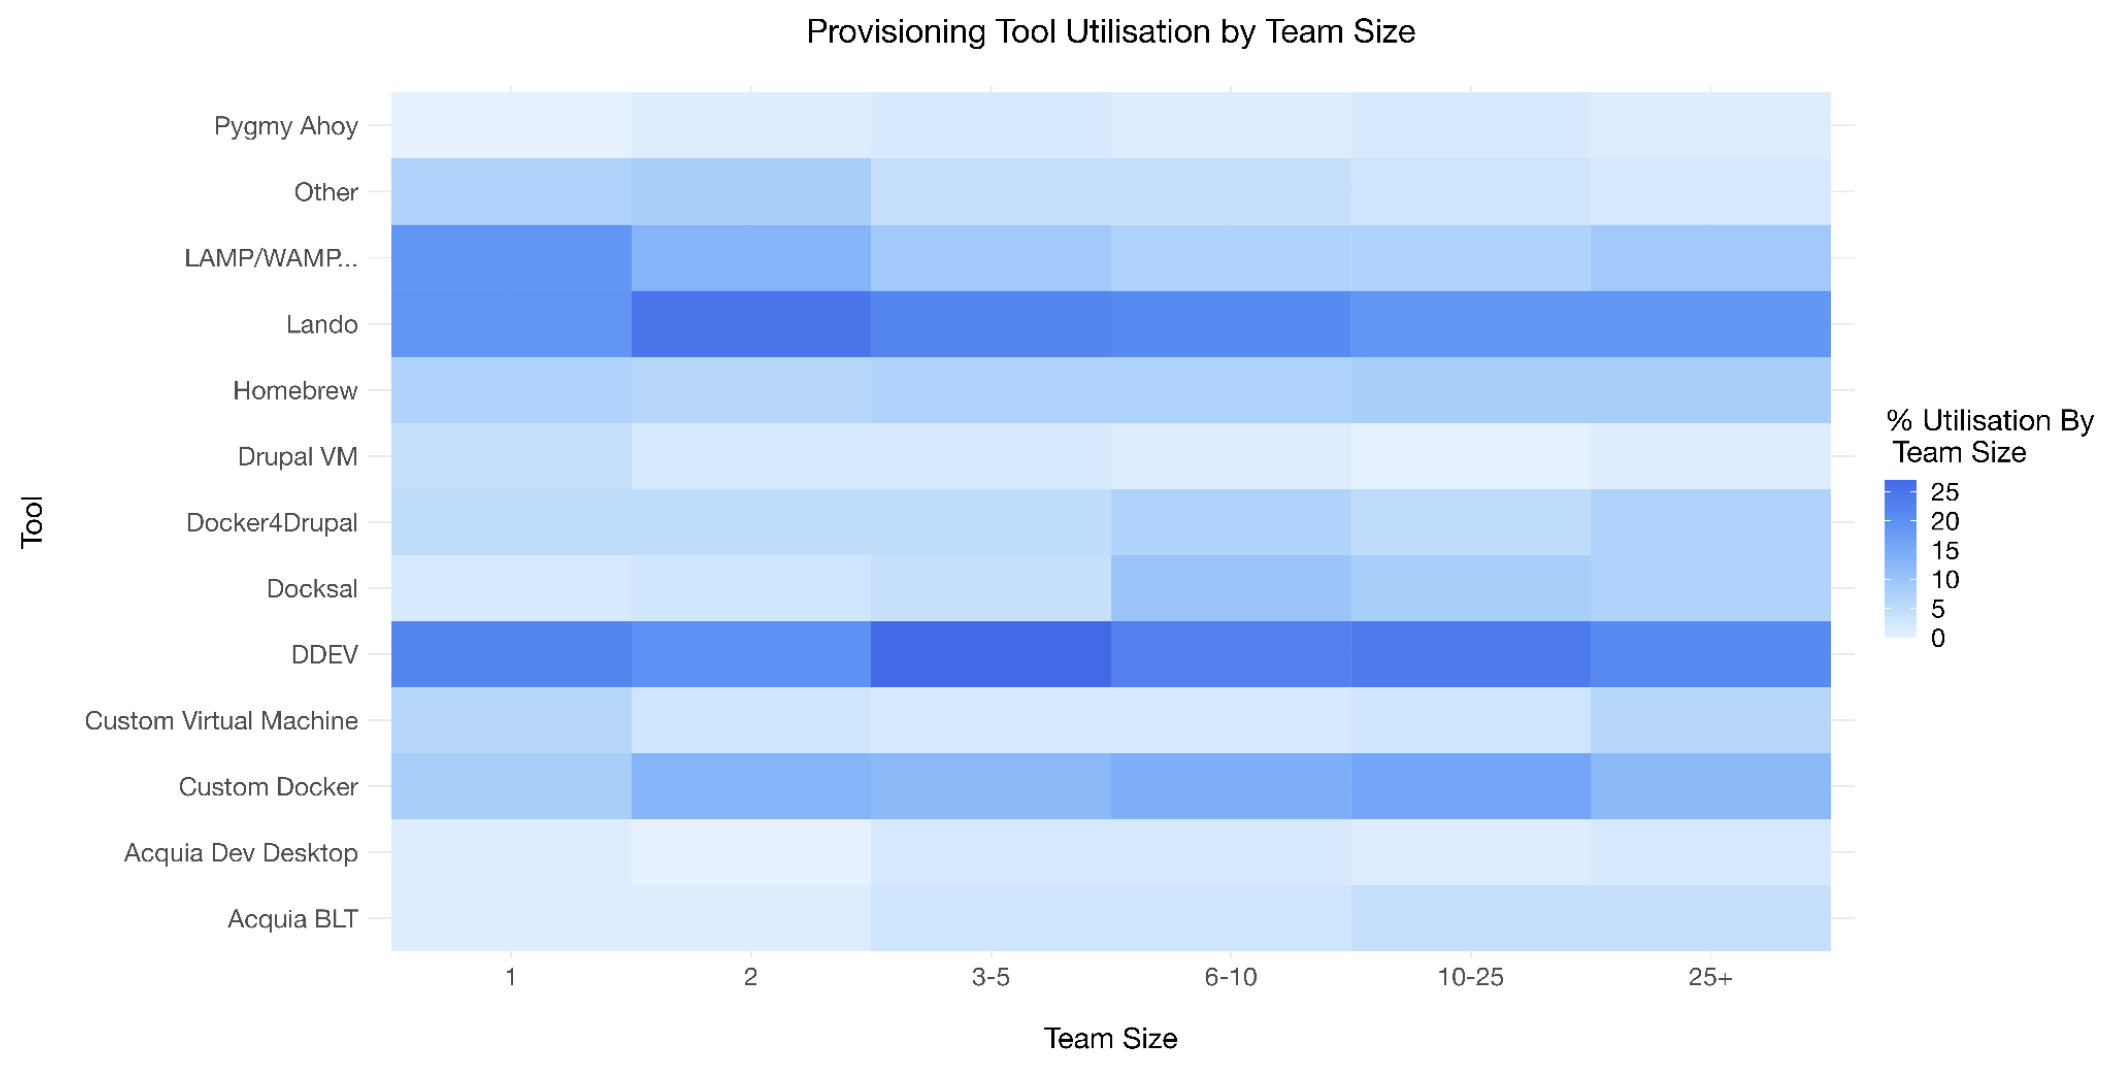
It was also interesting that DDEV seems to be slightly more popular within larger teams, although this might be a reflection of team sizes in the US generally being a bit larger than in other parts of the world.
Will Developers keep using these tools?
We asked people if they thought they’d still be using their preferred local environment manager in 12 months time. 86% answered yes, but the remaining 14% answered either Maybe or No.
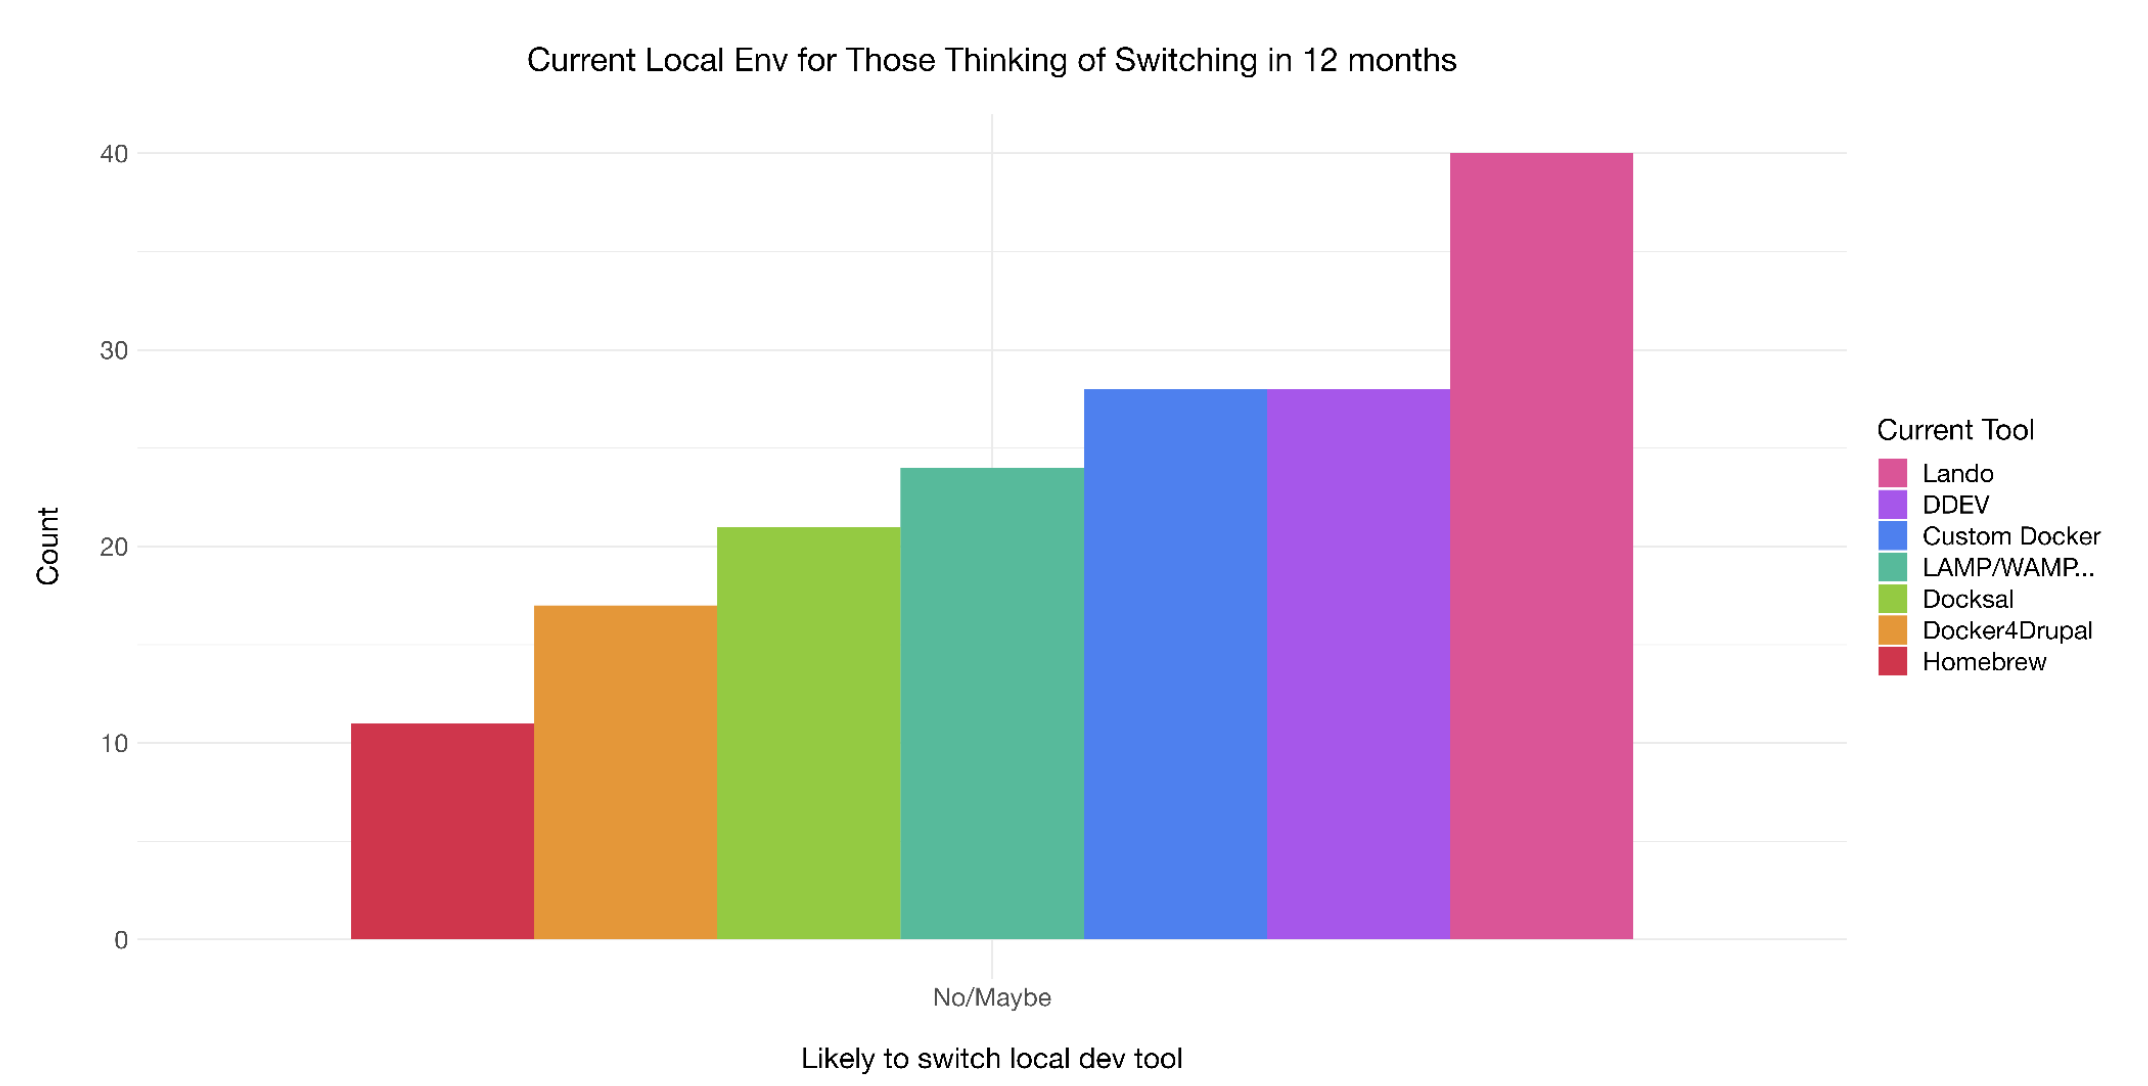
In this group, we saw that the users most likely to switch their local manager were using Lando, DDEV, or some kind of LAMP/WAMP stack. On the surface, this might seem like Lando users are more likely to switch than DDEV users. But when you look at the number of users, that’s about 7% of users thinking to switch who use Lando, versus 12% of users thinking to switch who use DDEV. So, it would appear that DDEV users are more likely to switch.
In per-capita terms, it’s mostly bad news for Docker4Drupal and Docksal, who had a total of 83 and 87 users respectively, so about one third of each of their users may be looking to switch.
Docker Usage and Skill Levels
Approximately 70% of respondents are using some variation of container-based local environments. This was expected, and we asked two questions regarding this.
The first was, “How comfortable are you working with Docker”, and the second “Do you feel like it’s important to understand how Docker works to be a Drupal dev these days?”
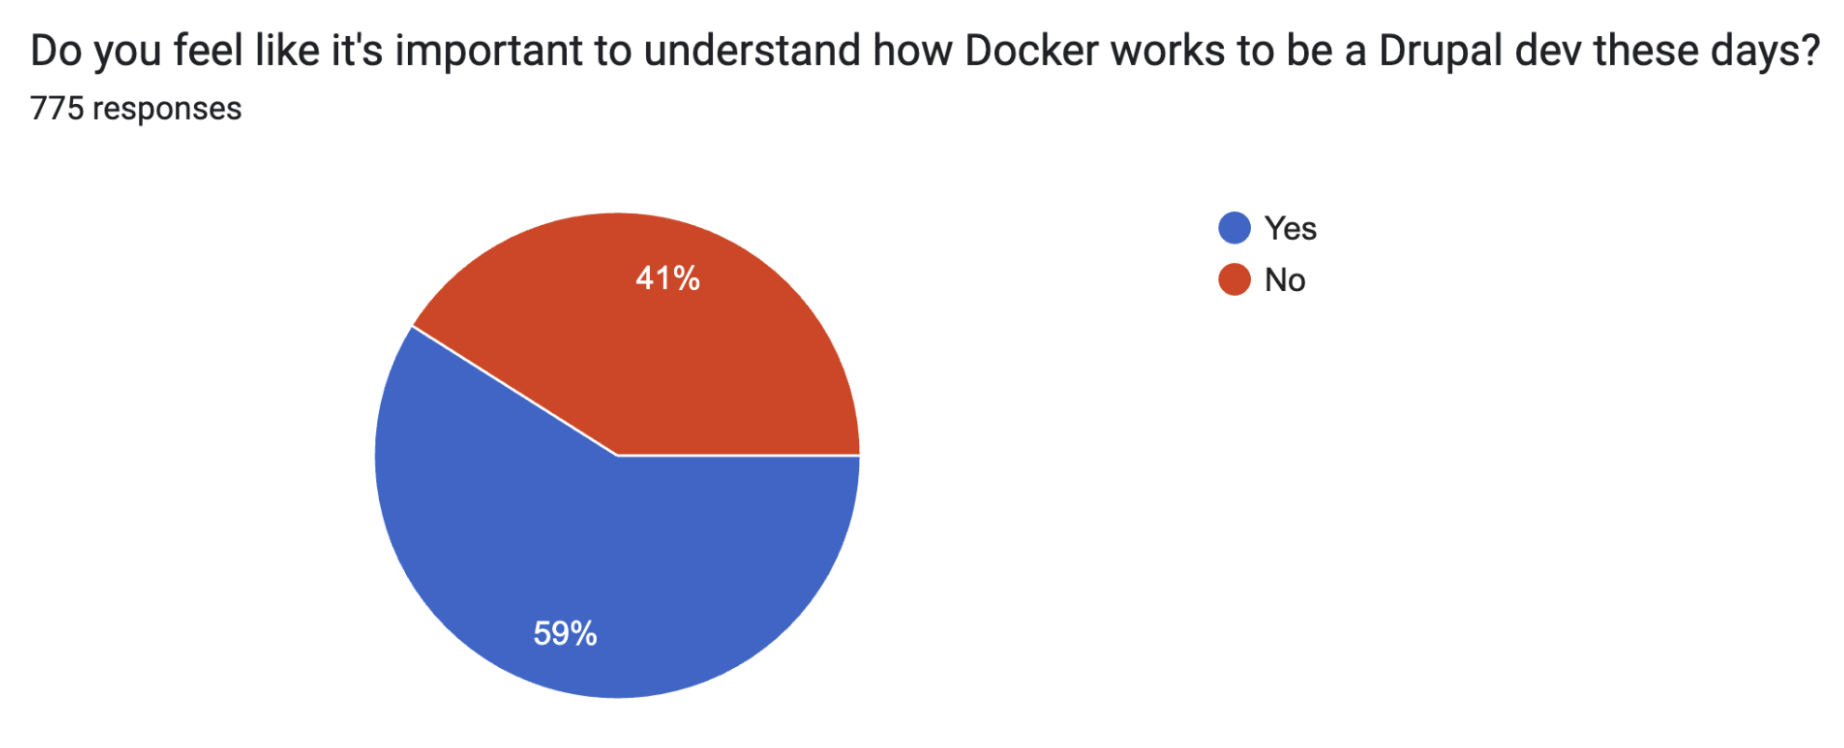
59% of respondents said it was important to know how to use Docker to be a Drupal dev. Which certainly isn’t surprising when we remember that 70% of respondents are using some form of Docker-based local dev environment.
What we were most interested in seeing with these two questions was: Did developers who were more familiar with Docker think it was more or less important?
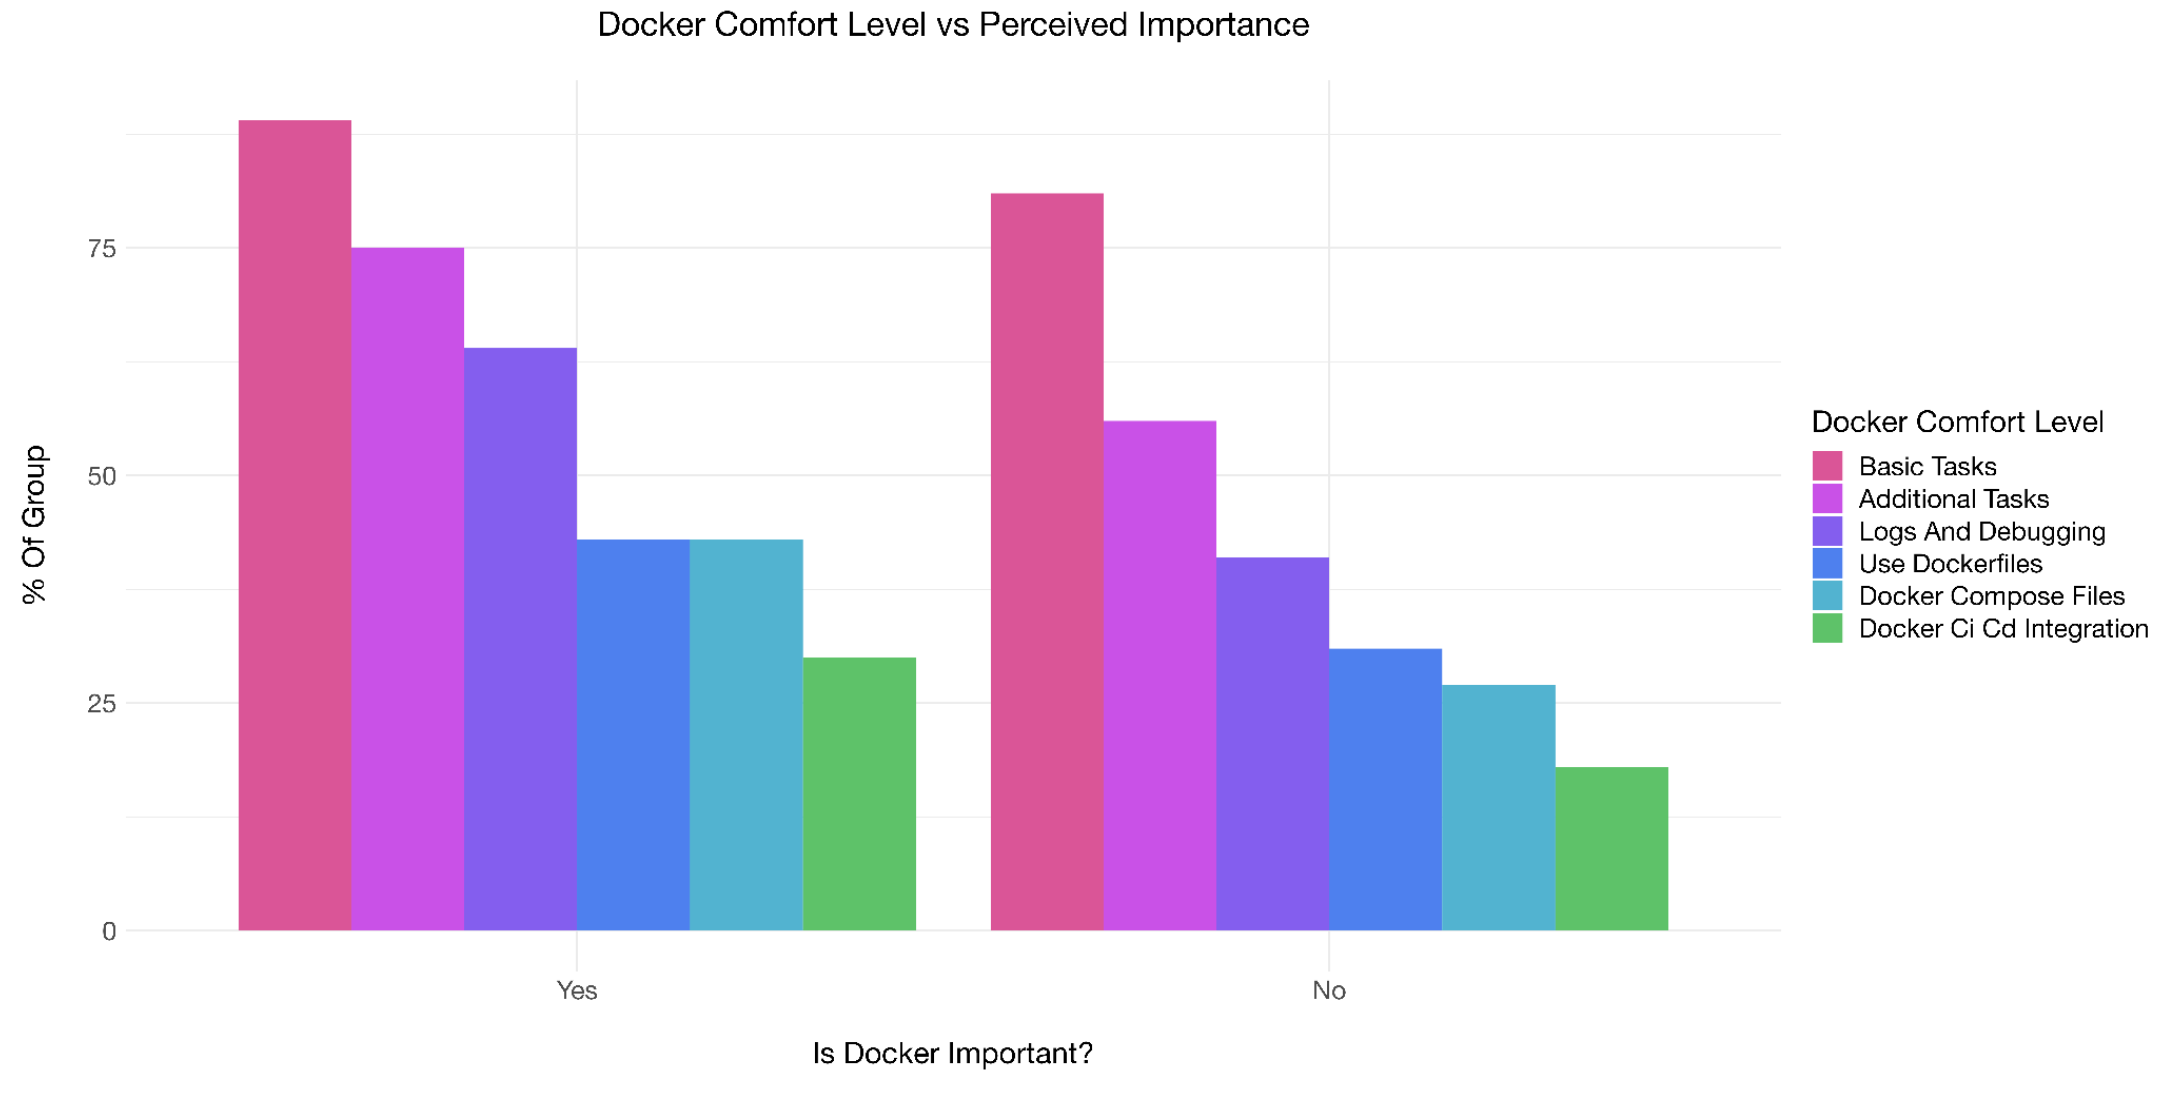
On this chart, you can see the responses split into two groups. On the left are people who think Docker is important, and on the right those that do not. Each bar shows the skill level of the respondent, showing if they can perform basic tasks, use docker files, use docker in CI/CD, and so on.
What this chart suggests is that regardless of your skill level with Docker, you’re about as likely to think it’s important to understand. Which we found a bit surprising - we had thought users with less experience would be much more likely to think it’s not important. There’s a lot of people out there who feel they don’t know Docker very well, but think that they should.
Operating System Usage
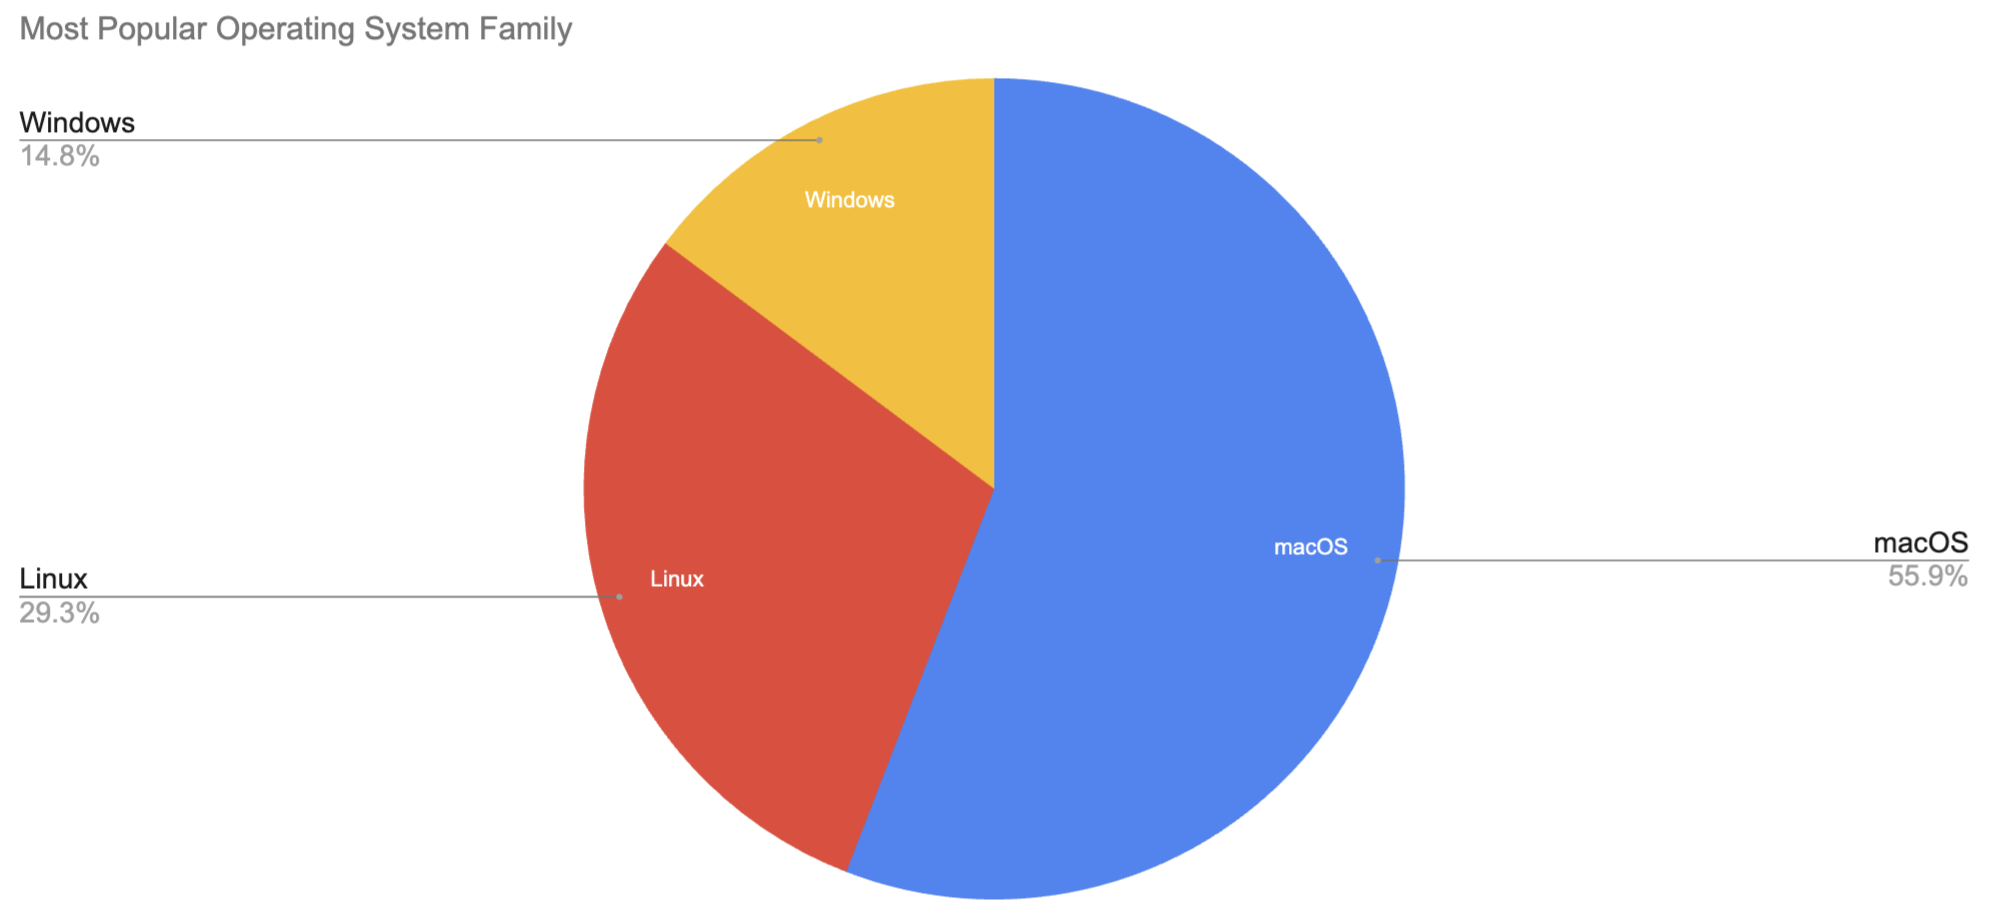
Operating system usage is mostly as you might expect it to be, with nearly 56% of users on Macs, Linux with 29%, and Windows with 15%.
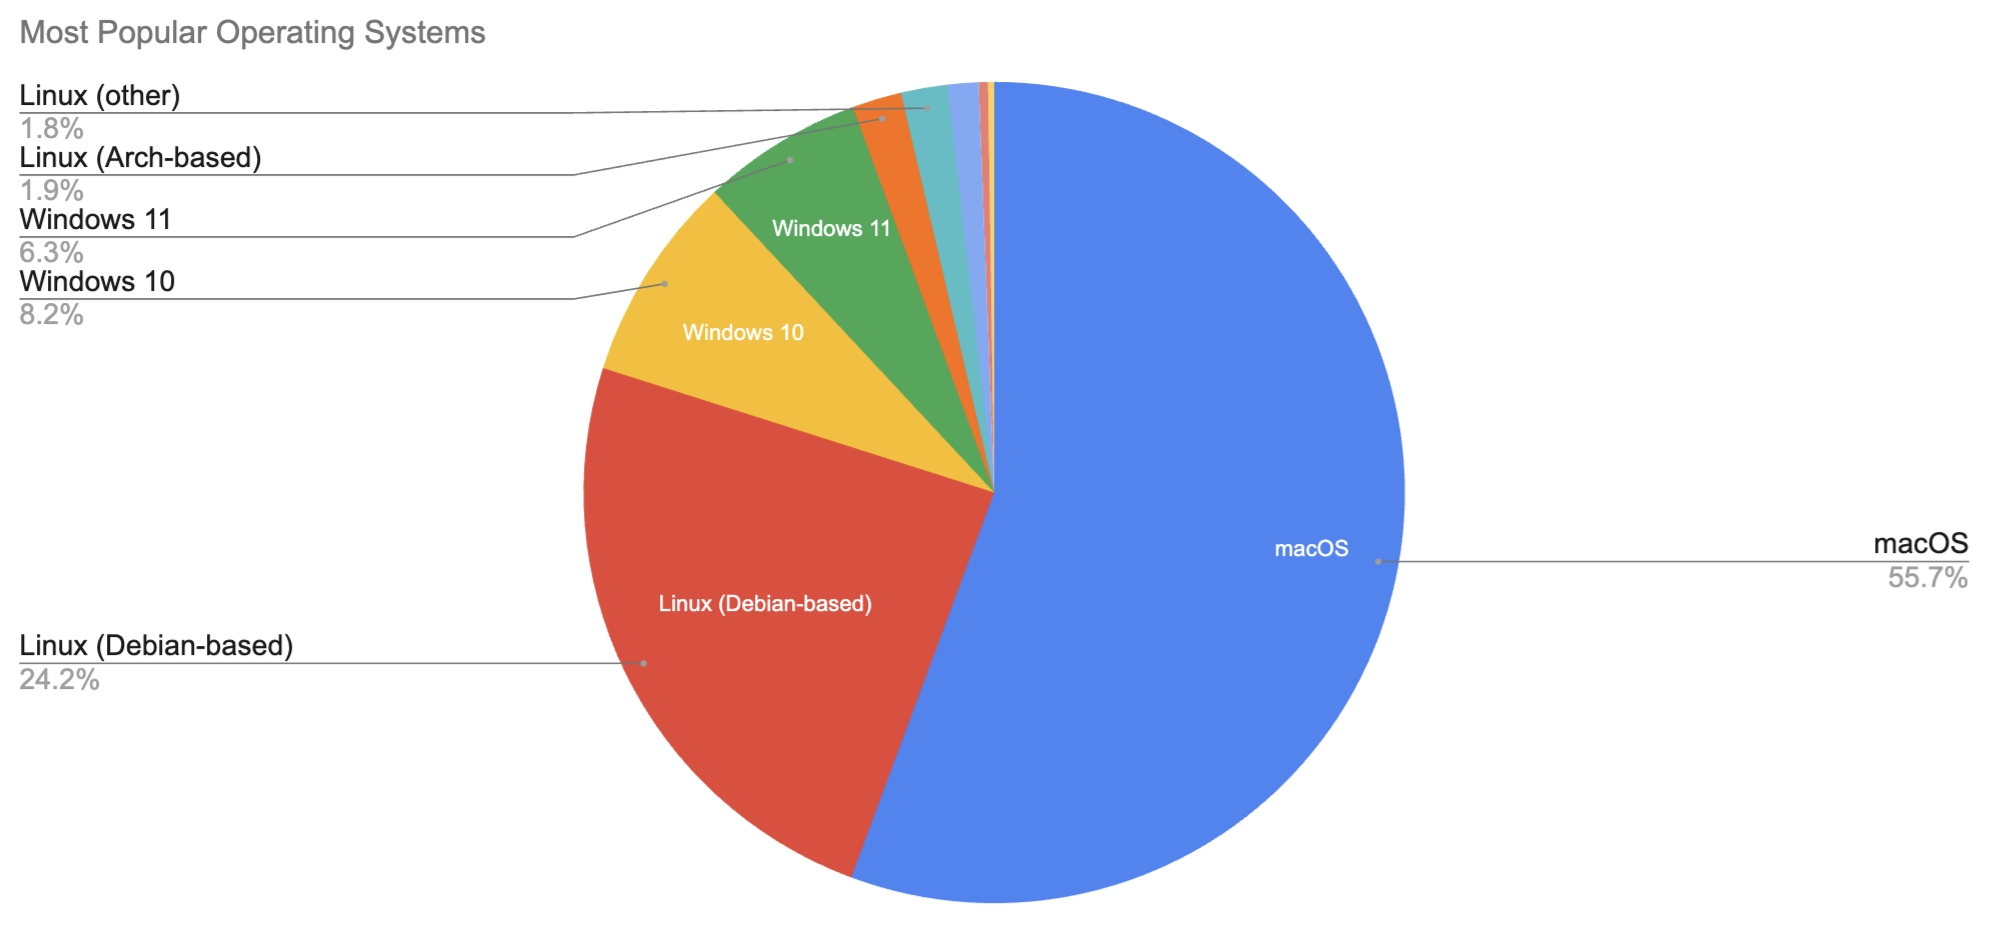
Drilling further down into individual operating system versions for Linux and Windows, we can see Debian-based Linux is overwhelmingly the most popular Linux distro family. Windows 10 still edges out Windows 11, nearly 2 years after Windows 11 was released.
It’s worth noting that we had a few respondents who took the time to point out that they use Linux under the Windows Subsystem for Linux. We’ll improve that question next year to better represent when people use Linux for development, even if that Linux installation is wrapped in Windows or running as a VM.
We didn’t ask which specific version of macOS people were running, simply because it doesn’t seem as meaningful as the difference between Linux and Windows versions, and the vast majority of macOS users upgrade to the latest version very quickly.
IDE / Editor
Next we asked folks “Which IDE/editor do you use?”. We got a lot of feedback on this question letting us know that people wanted to specify multiple editors here, which makes sense, and we’ll do that next year.
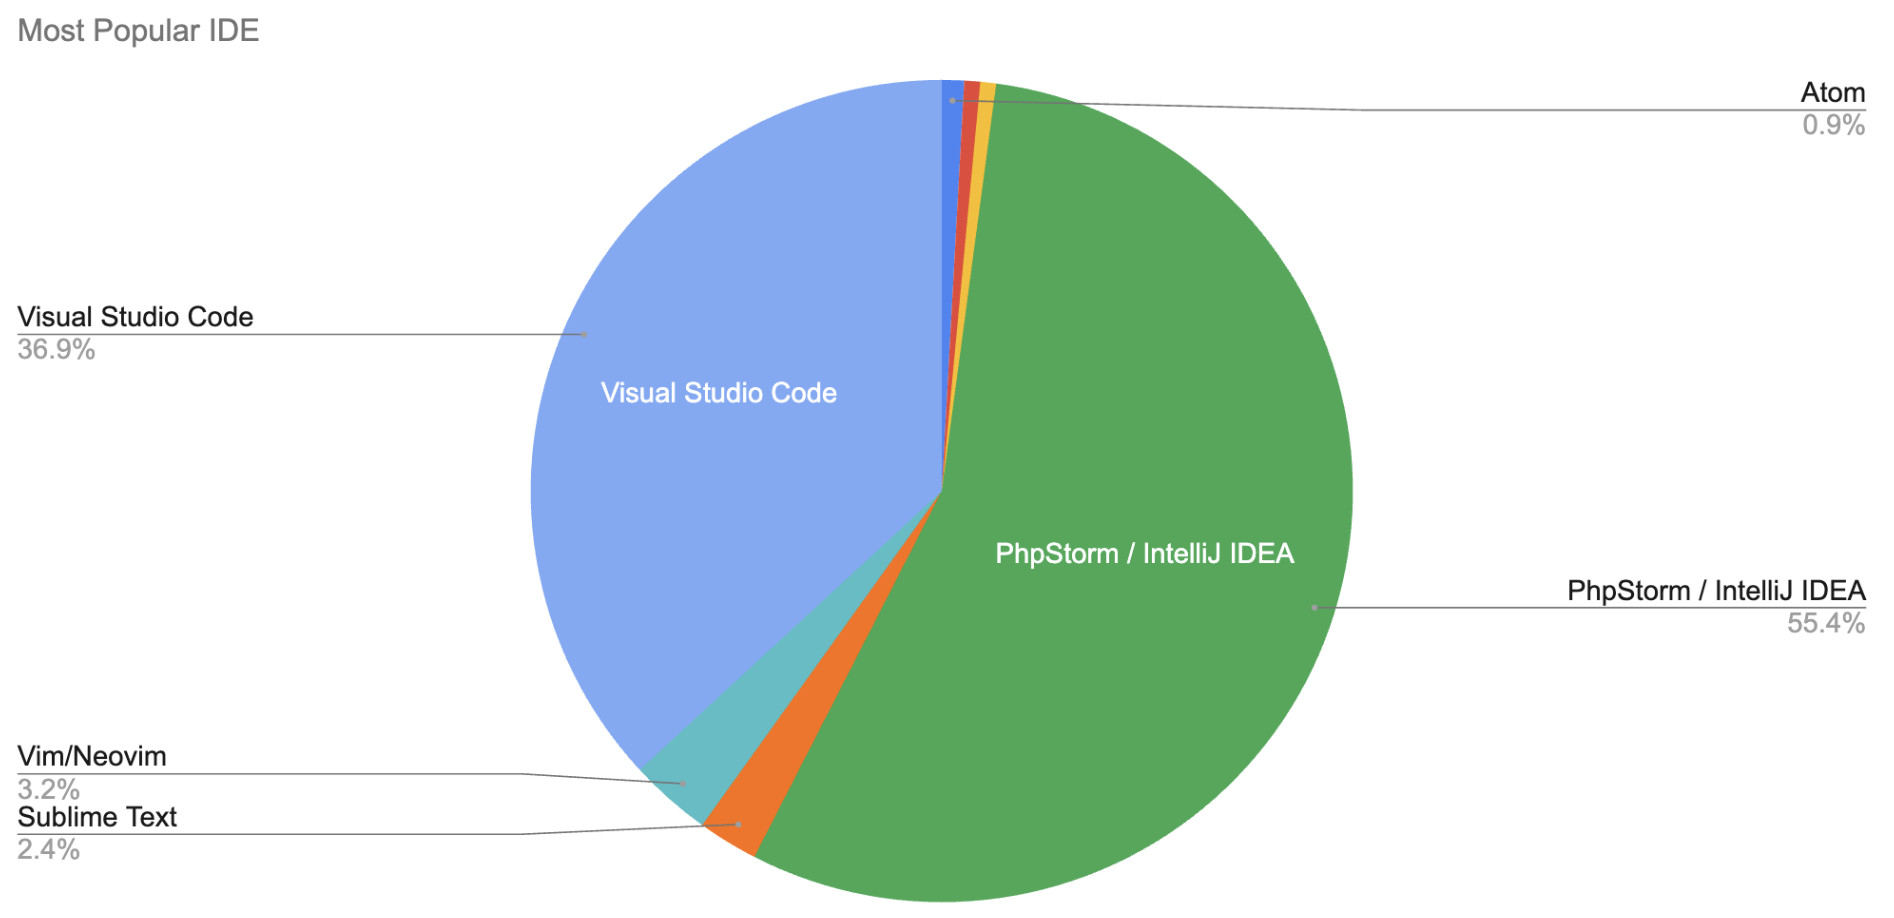
PhpStorm is still the main IDE of choice, followed closely by VS Code. There were only 3 VSCodium users out of 826 responses to this question. VSCodium being the fully open source variant of VSCode. It would have been nice to see that get more adoption.
Personally from my own little bubble I would have expected to see more Vim users, because I’ve seen a few people switch lately, and that’s what I use. But even though it was the 3rd most popular editor, it came in at just over 3% of respondents.
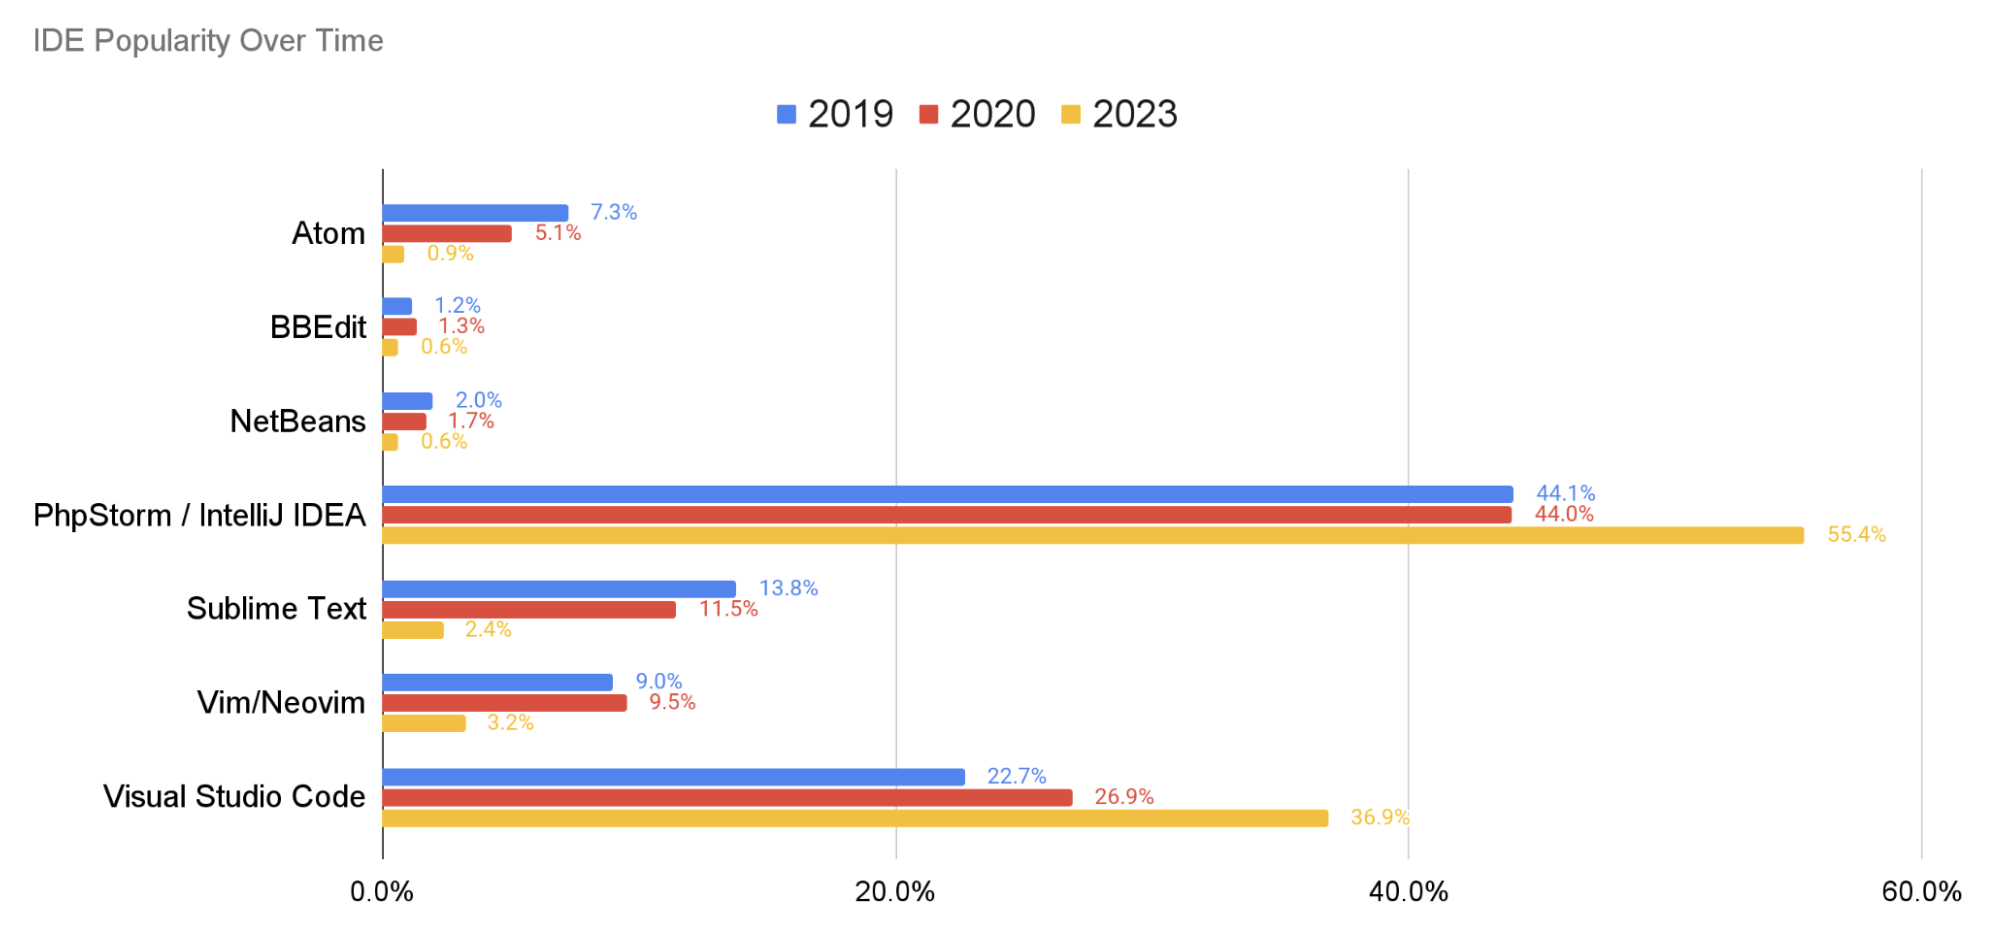
More interestingly, is how this data has changed over time. You can see here in blue/2019, red/2020, and yellow/2023. PhpStorm and VSCode have both increased their market share, which, it seems, is mostly being achieved by eating up the market share of less popular editors, rather than taking market share from eachother.
In other words, it appears that users new to VSCode didn't switch over from PhpStorm, and vice-versa.
Quality Assurance
Let’s talk about quality assurance. We asked which quality assurance controls were in place, keeping mostly the same answers as were found in 2020’s survey, but also adding the option for custom responses.
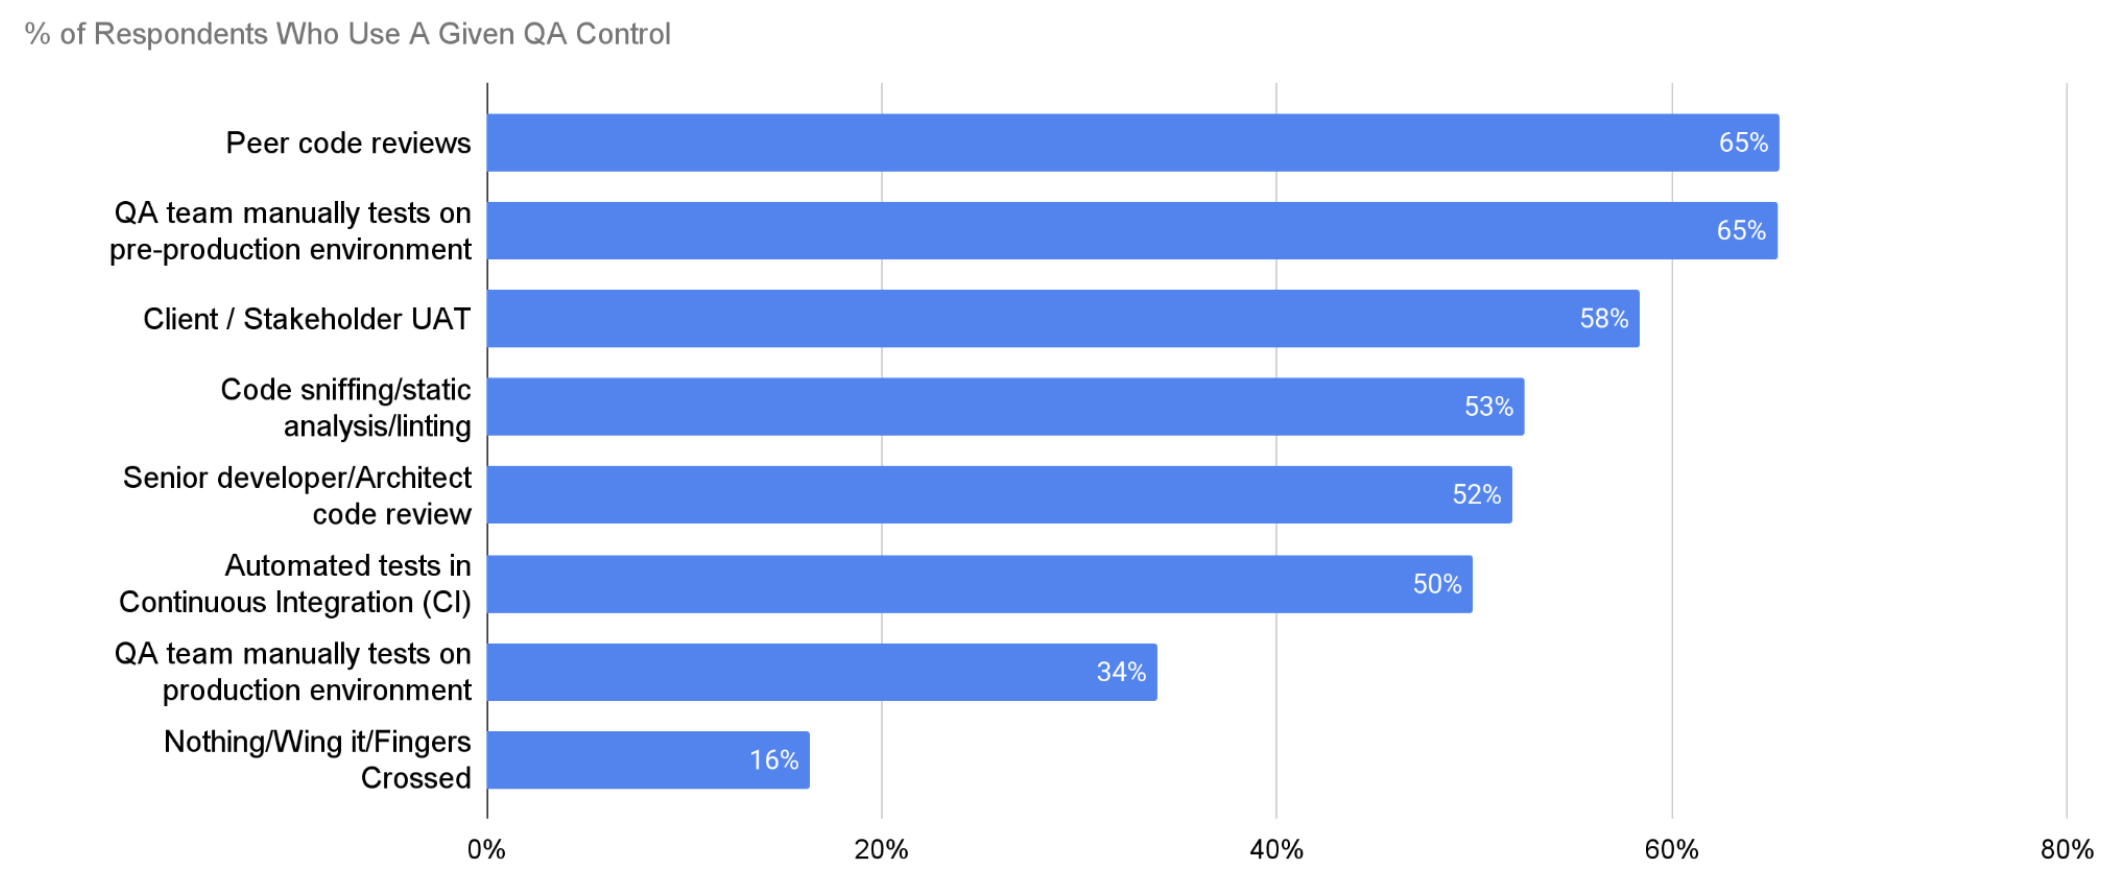
Here we see the percentage of respondents who use a given QA control, with the vast majority of respondents using more than one.
Personally, I was at first surprised that only 65% of respondents are doing some form of code reviews, but then I remembered that 17% of respondents are out there working alone as the only Drupal dev on their projects.
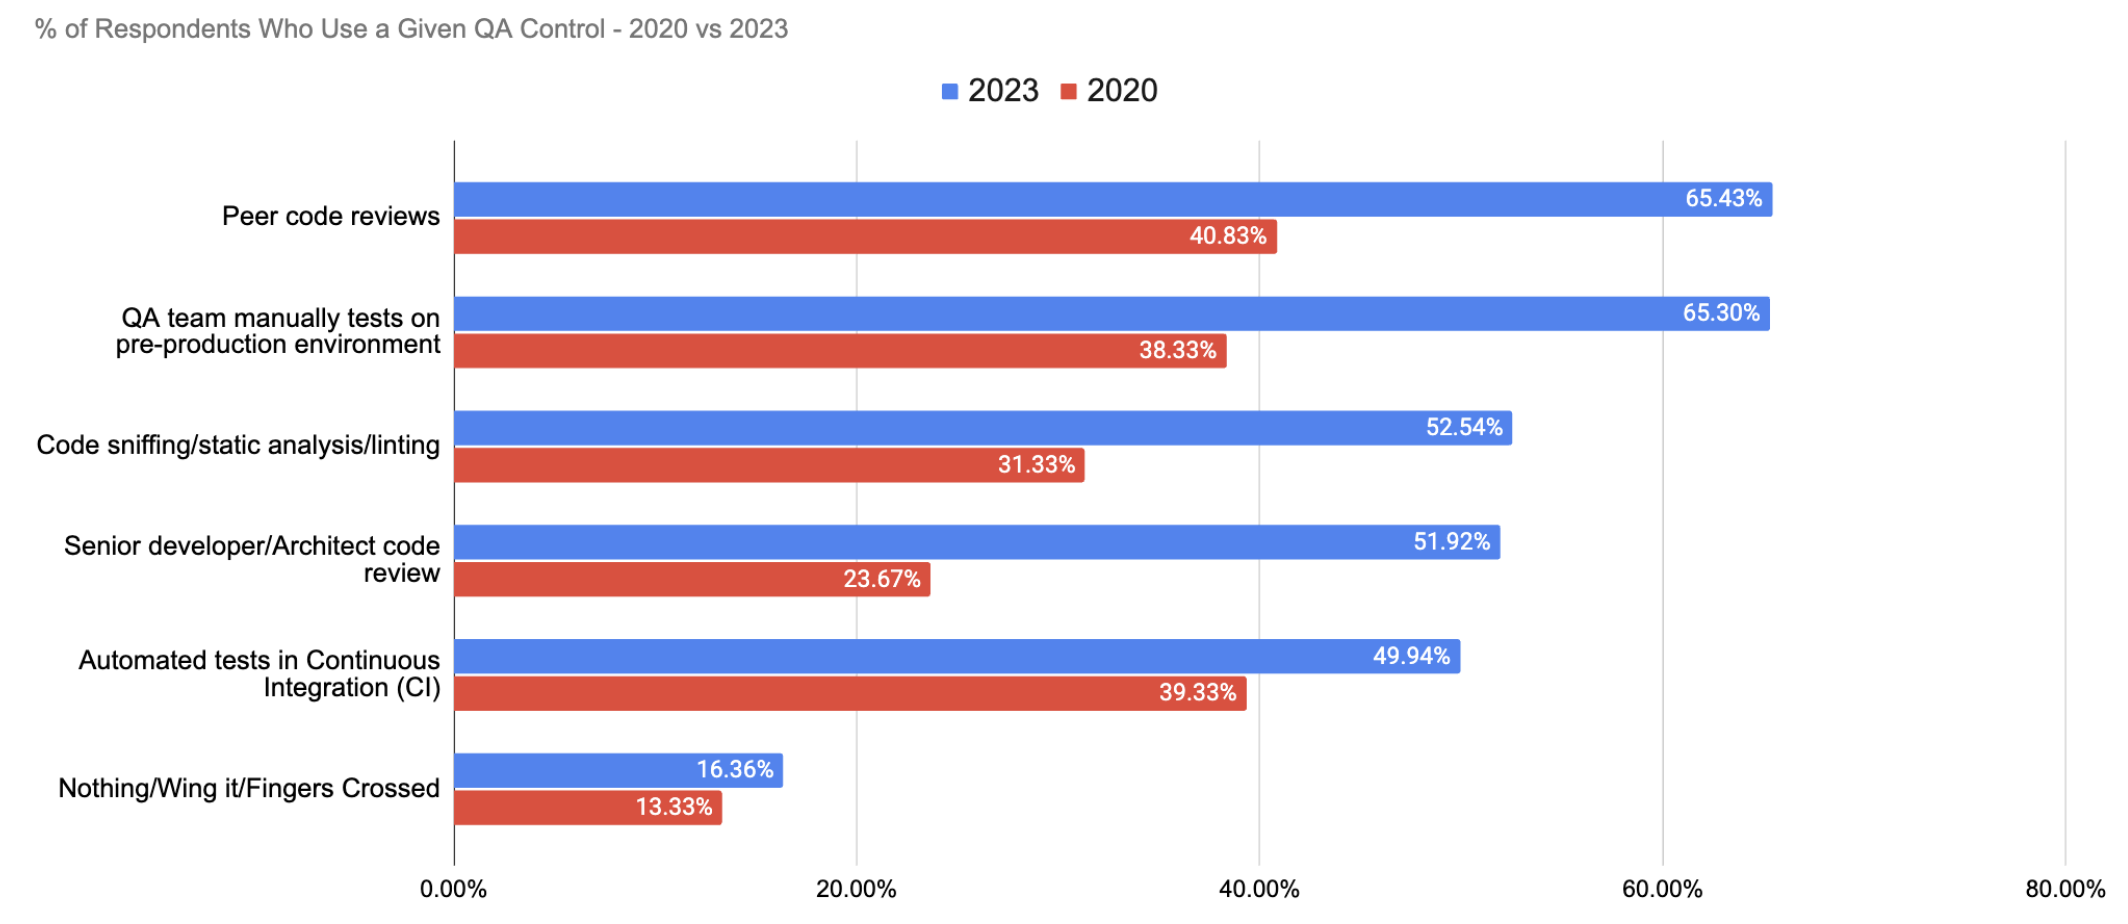
We can also see that adoption of QA controls is improving, which is great. When comparing some of the values in the 2020 survey, we can see a significant rise in adoption of nearly all quality controls, but also a small increase for respondents expressing a total lack of control.
Future with Drupal
We asked respondents if they felt they’d still be working with Drupal one year from now, with 1% saying No, and 9.5% saying Maybe.
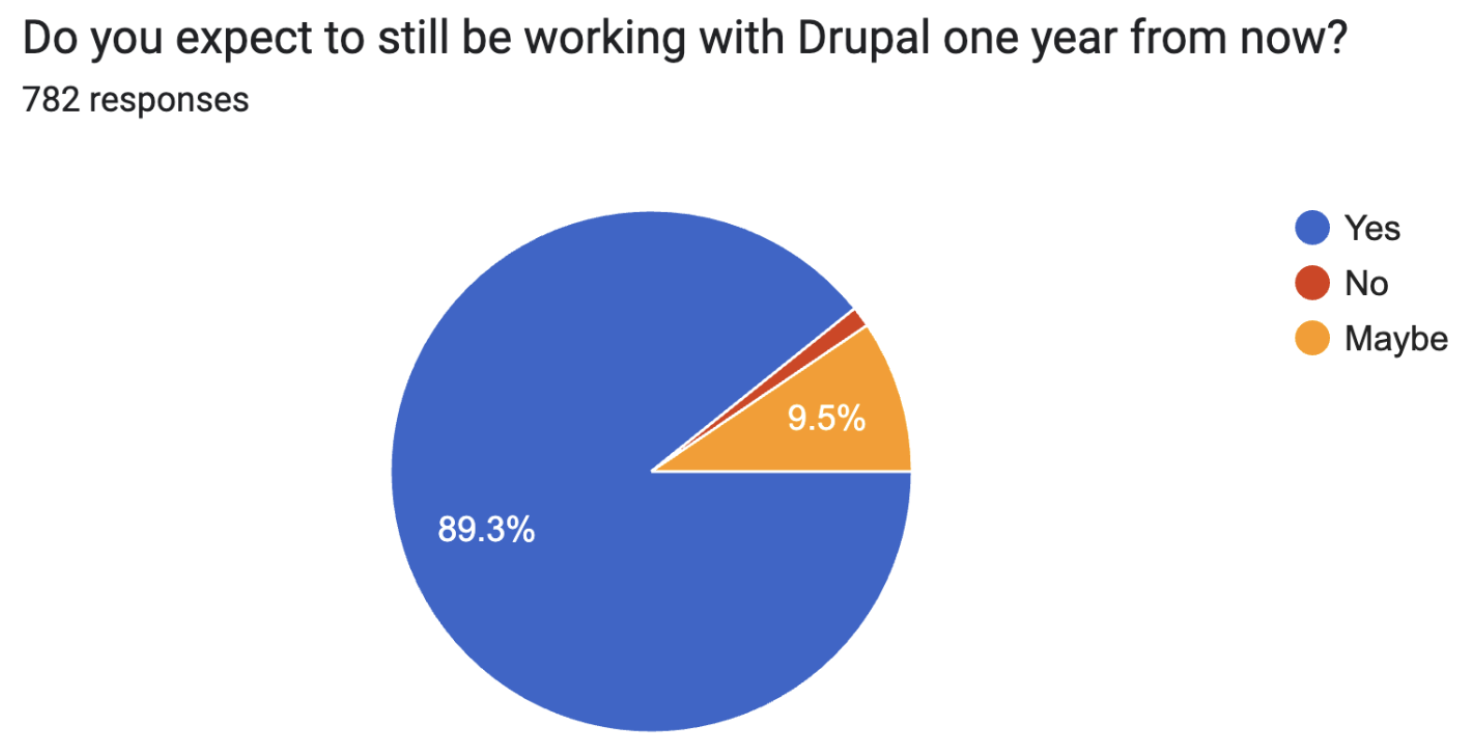
That seems like a relatively high number, but unfortunately don’t have data from earlier surveys to compare it against.
We did wonder though, for those roughly 10% of Drupal users who are thinking of leaving in the next year, where might they be going? So, we looked at the usage of non-Drupal frameworks within this cohort:
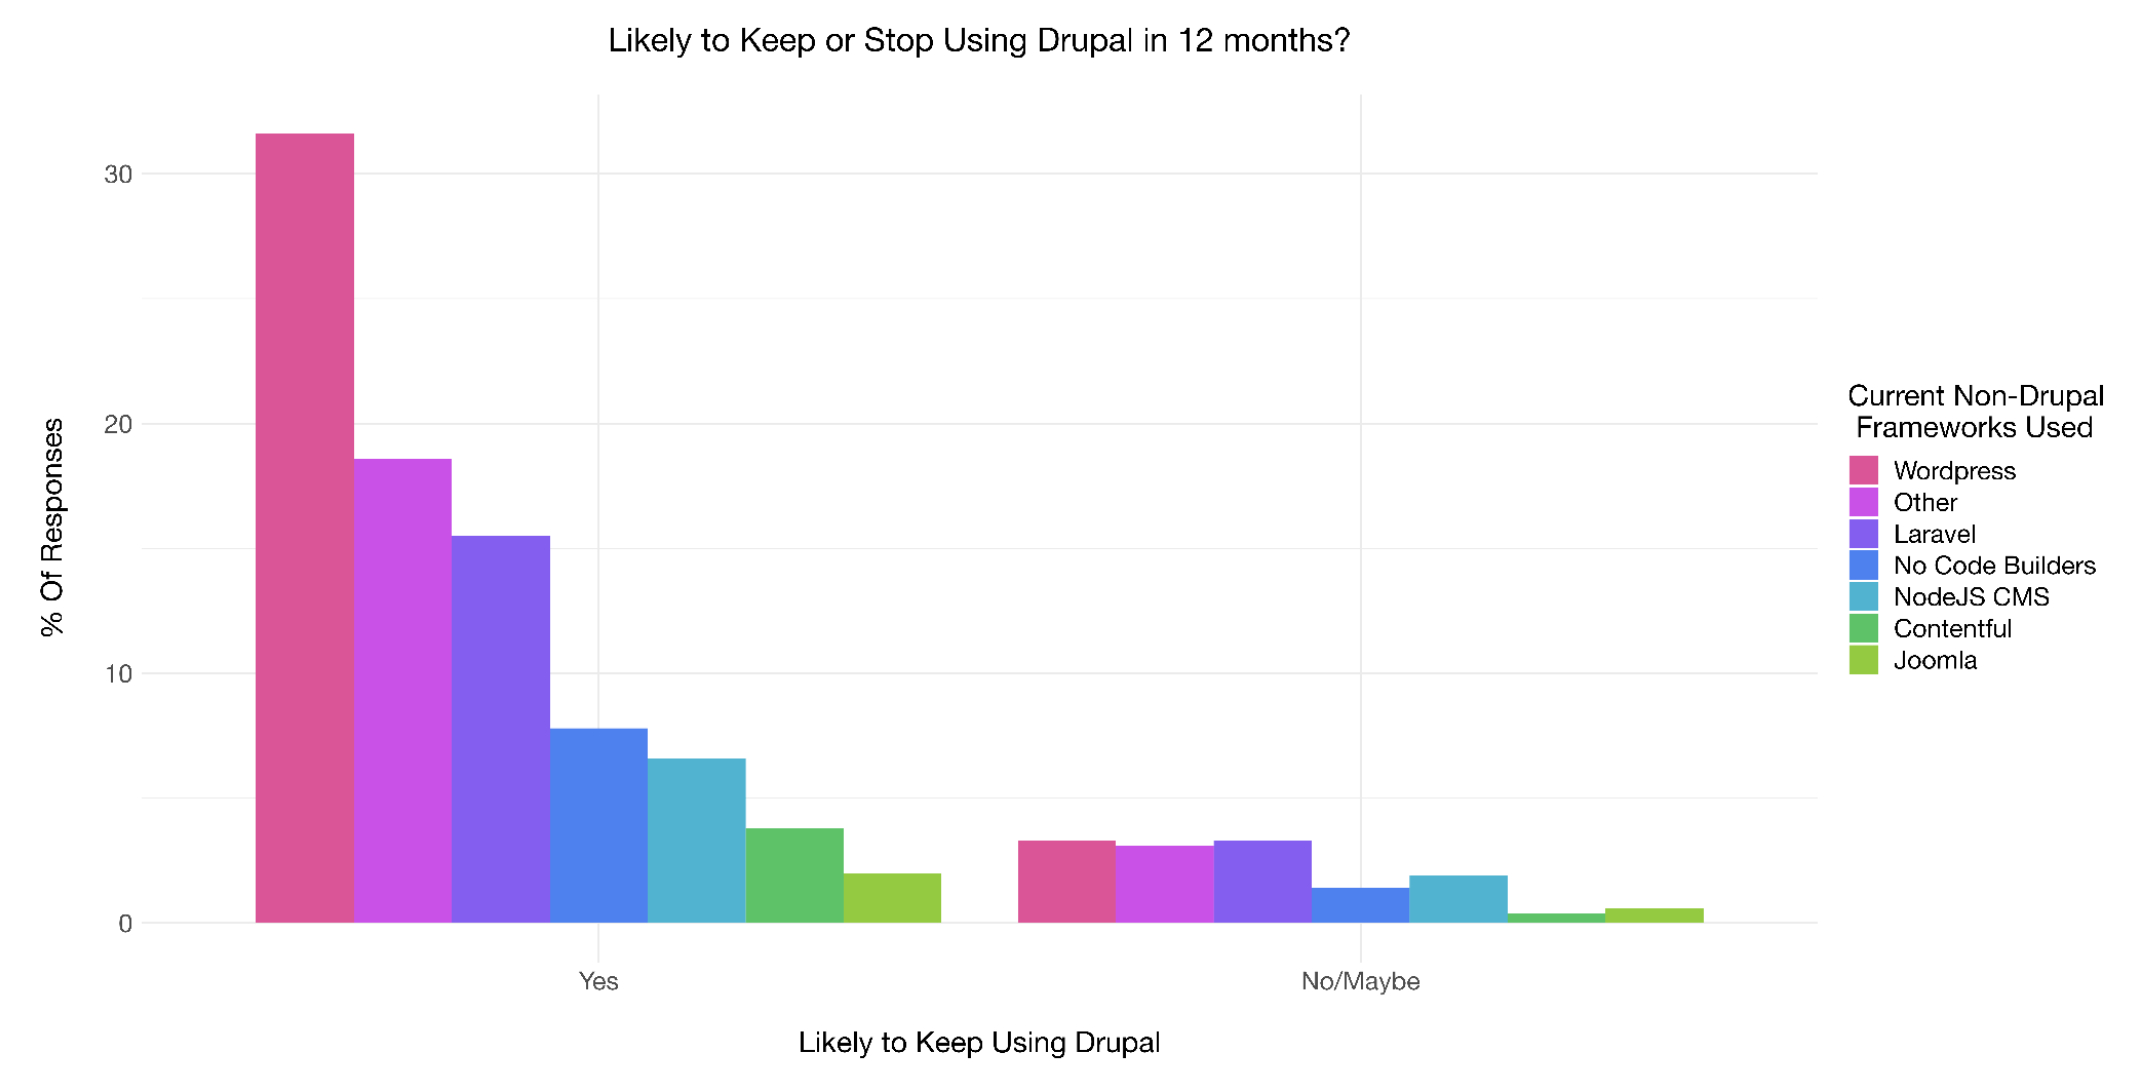
The idea with this view was - have these people stumbled on to something better? There was no clear message there. Next year we’ll ask a follow-up question to try to better understand why some people might move to other solutions.
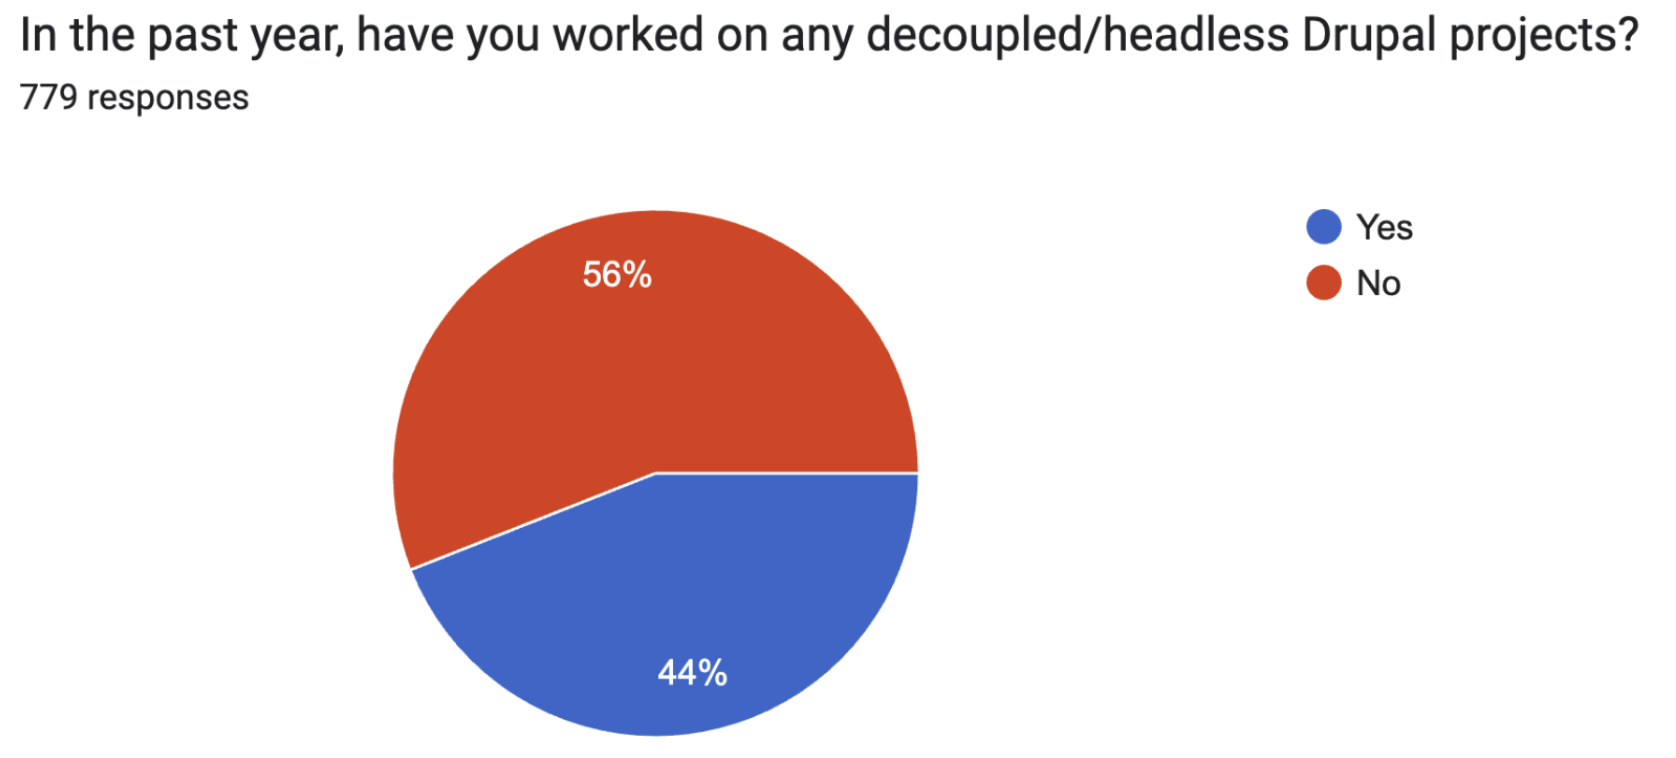
Headless and Decoupled Drupal
We also asked respondents if they had worked on any decoupled or headless projects in the past 12 months: 44% responded Yes, and 56% responded No.
Hosting Providers
We asked respondents who they used to host their production websites and received a lot of answers. Most respondents were using more than one host, so we collected a lot of varying data for this question.
The variation in answers posed a challenge in how to interpret and collate certain responses. For example, there were many responses for the different kinds of self-managed hosting. On their own, these would have been too small to draw any significant conclusions from, so we aggregated some of these into “Unspecified Self-hosted”.
So, this category, which accounts for about 5% of all hosting, can be taken to mean anything from bare metal servers to self-managed Kubernetes.
For this presentation, we felt it was more meaningful to show the folks going it alone, rather than to show all the variations which each accounted for less than 5 users. Deciding how to meaningfully interpret and present data like this was one of the most unexpected challenges of organising the survey.
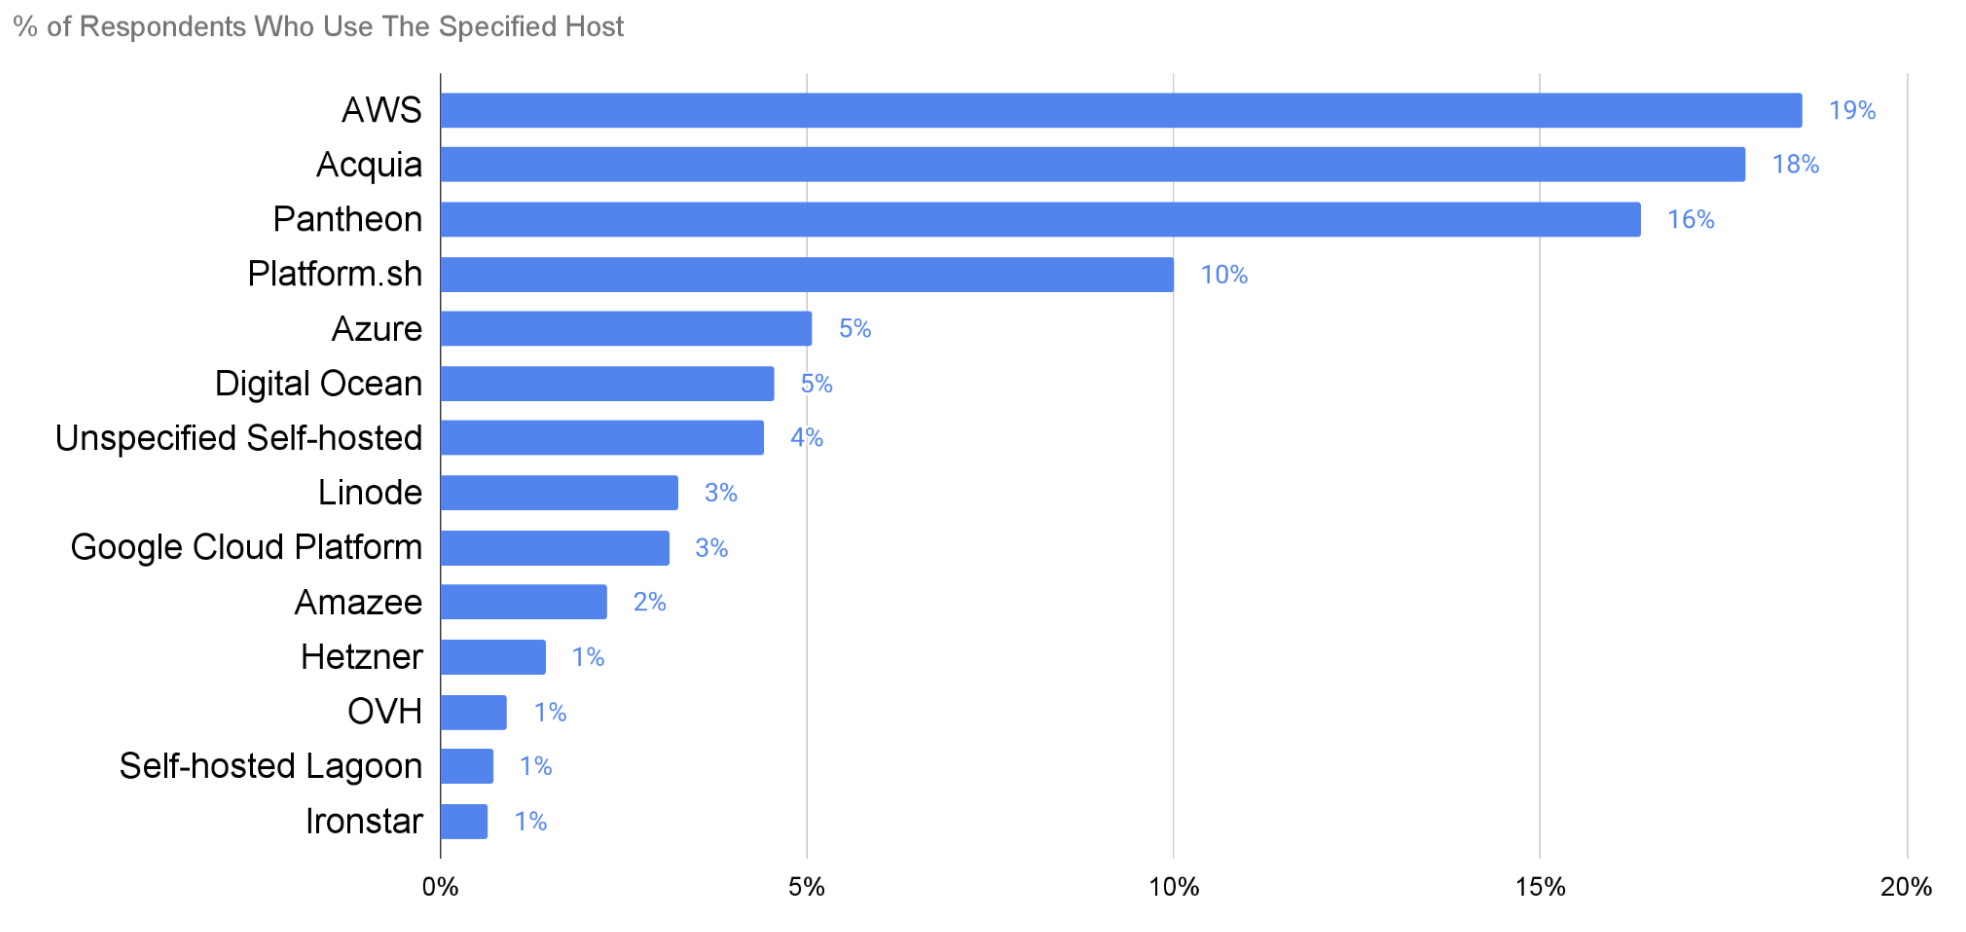
Because most people are using more than one host, we will look at this the same way we did QA controls, by seeing which percentage of responses included a particular host.
Not surprisingly, when looking at the pure Drupal PaaS providers, we see Acquia, Pantheon, and Platform.sh on top with 18%, 16%, and 10% share each. There are no clear winners in the hosting game, which we found very interesting.
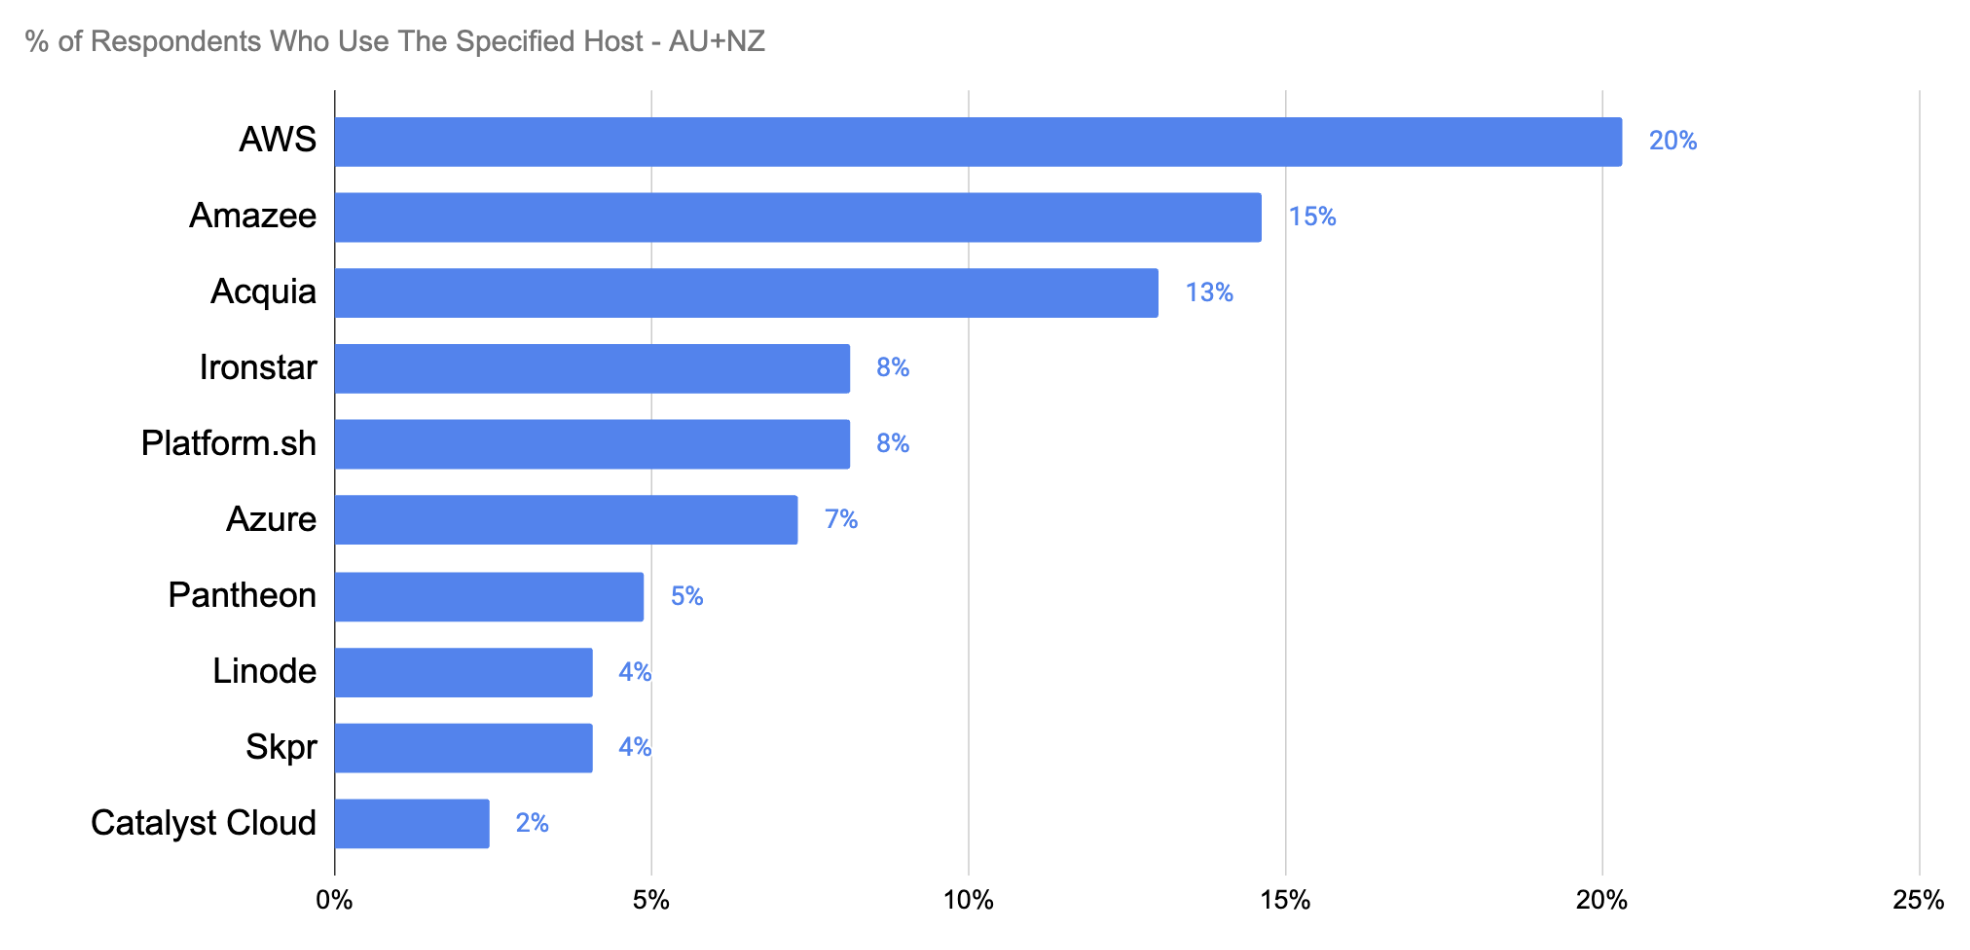
Looking locally to just the Australia/NZ market, we can see the balance shifts quite significantly, with Acquia losing out on its top PaaS spot to Amazee, which is likely boosted by Amazee hosting GovCMS. Pantheon also drops quite a few spots down to 5%, presumably due to their late entry into the local market when compared to other providers like Platform and Acquia.
We also see good representation for locally owned providers like Ironstar, Skpr, and Catalyst Cloud. If you’re among those users, thank you for buying local.
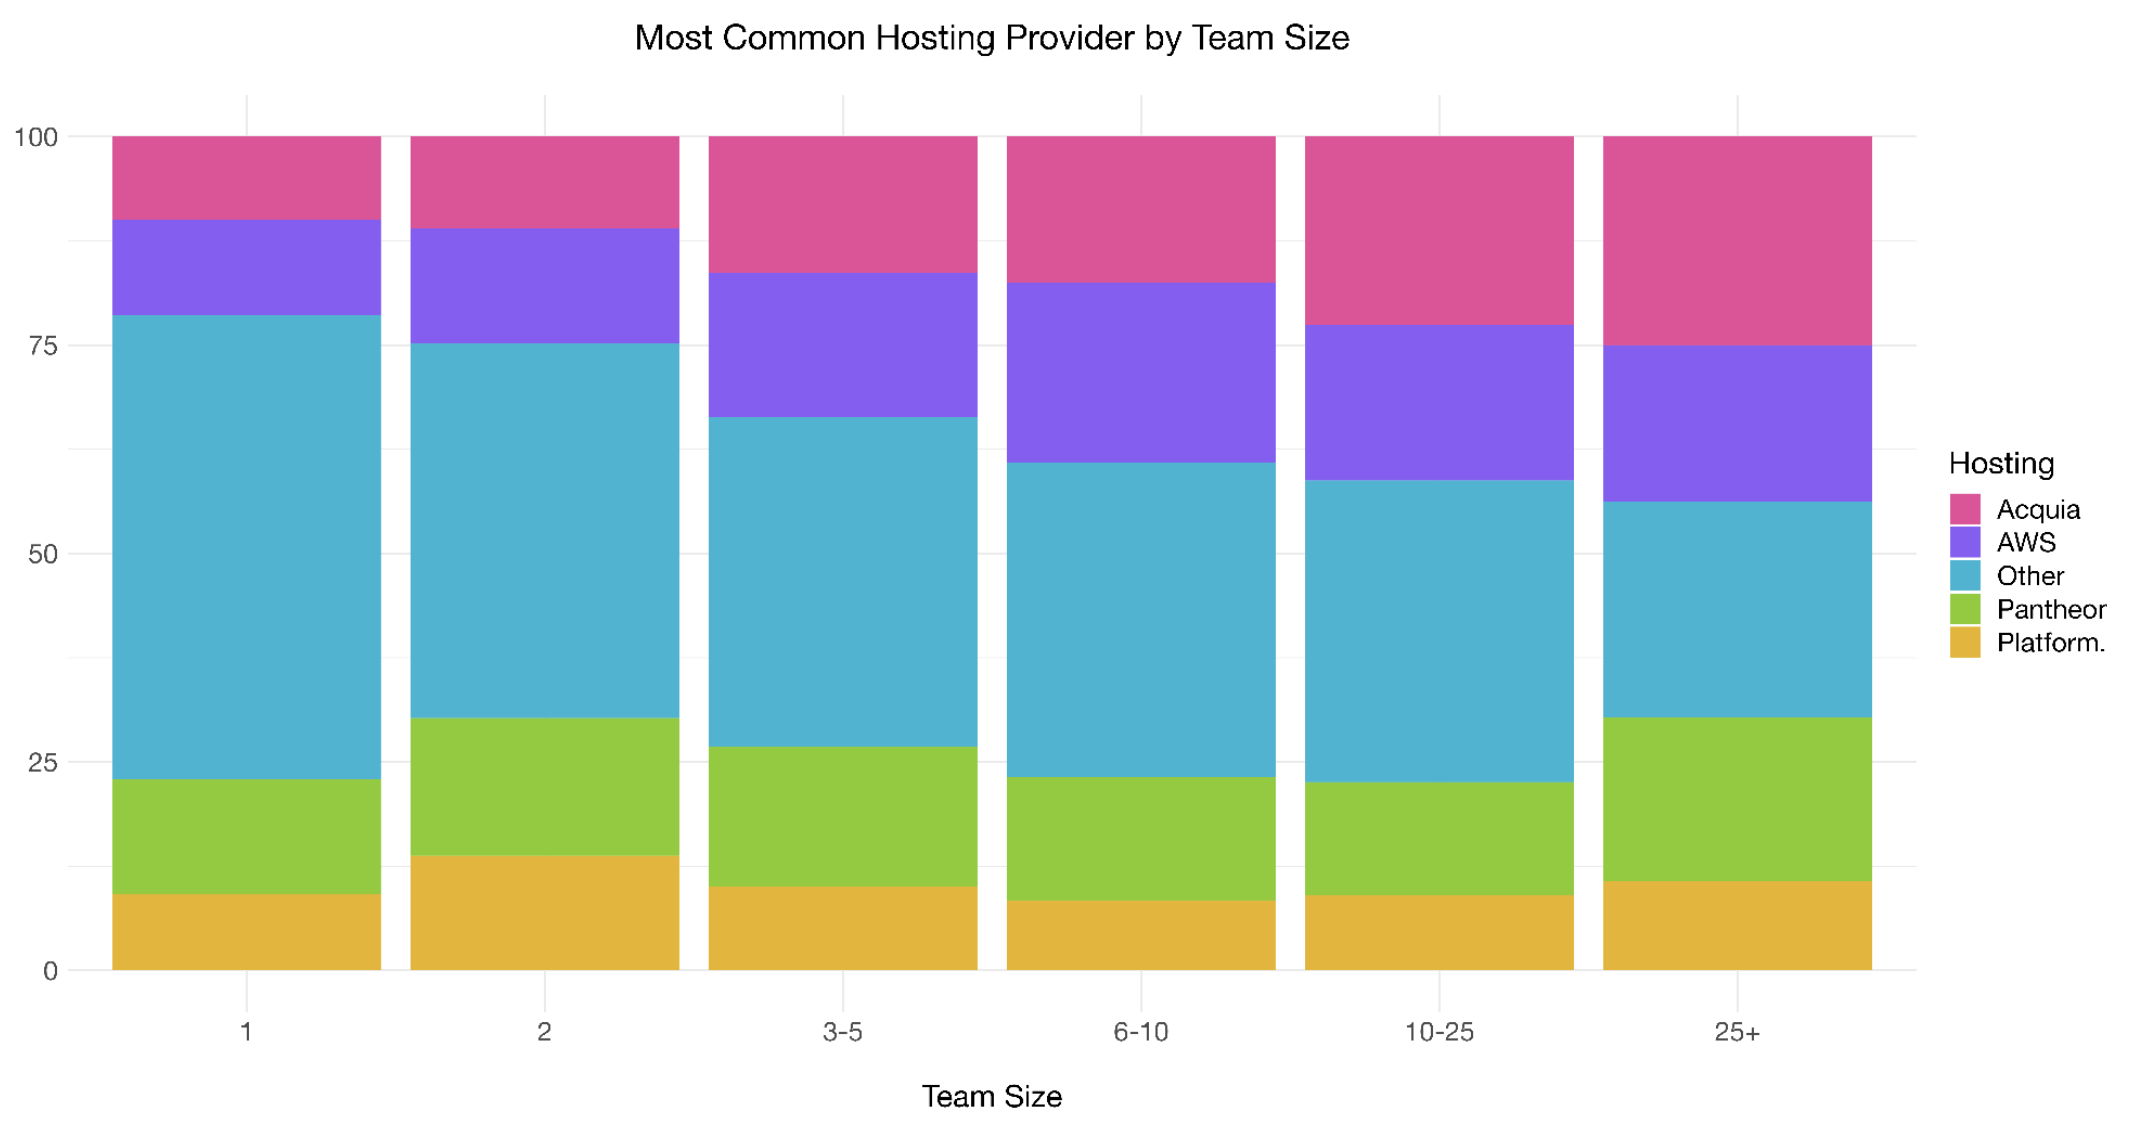
Finally on hosting, and looking again at the global numbers now, we thought it was interesting to see how the major providers changed when looking at the organisation size.
As you can see, larger teams are more likely to use managed Drupal hosting with Pantheon, Platform, and especially Acquia having a larger market share when there are more than 25+ people working on the team.
Security Controls
We asked respondents which security controls they were using to protect their Drupal sites. What you see here is adoption of each control type out of only the people who answered this question.
There were about 143 people, or 17% of respondents who didn’t answer this question at all. It was at the tail end of the survey, so that may be because of fatigue, or simply because they didn’t know the answers. A handful of people answered that this was whatever their host used, or whatever their infrastructure team did.
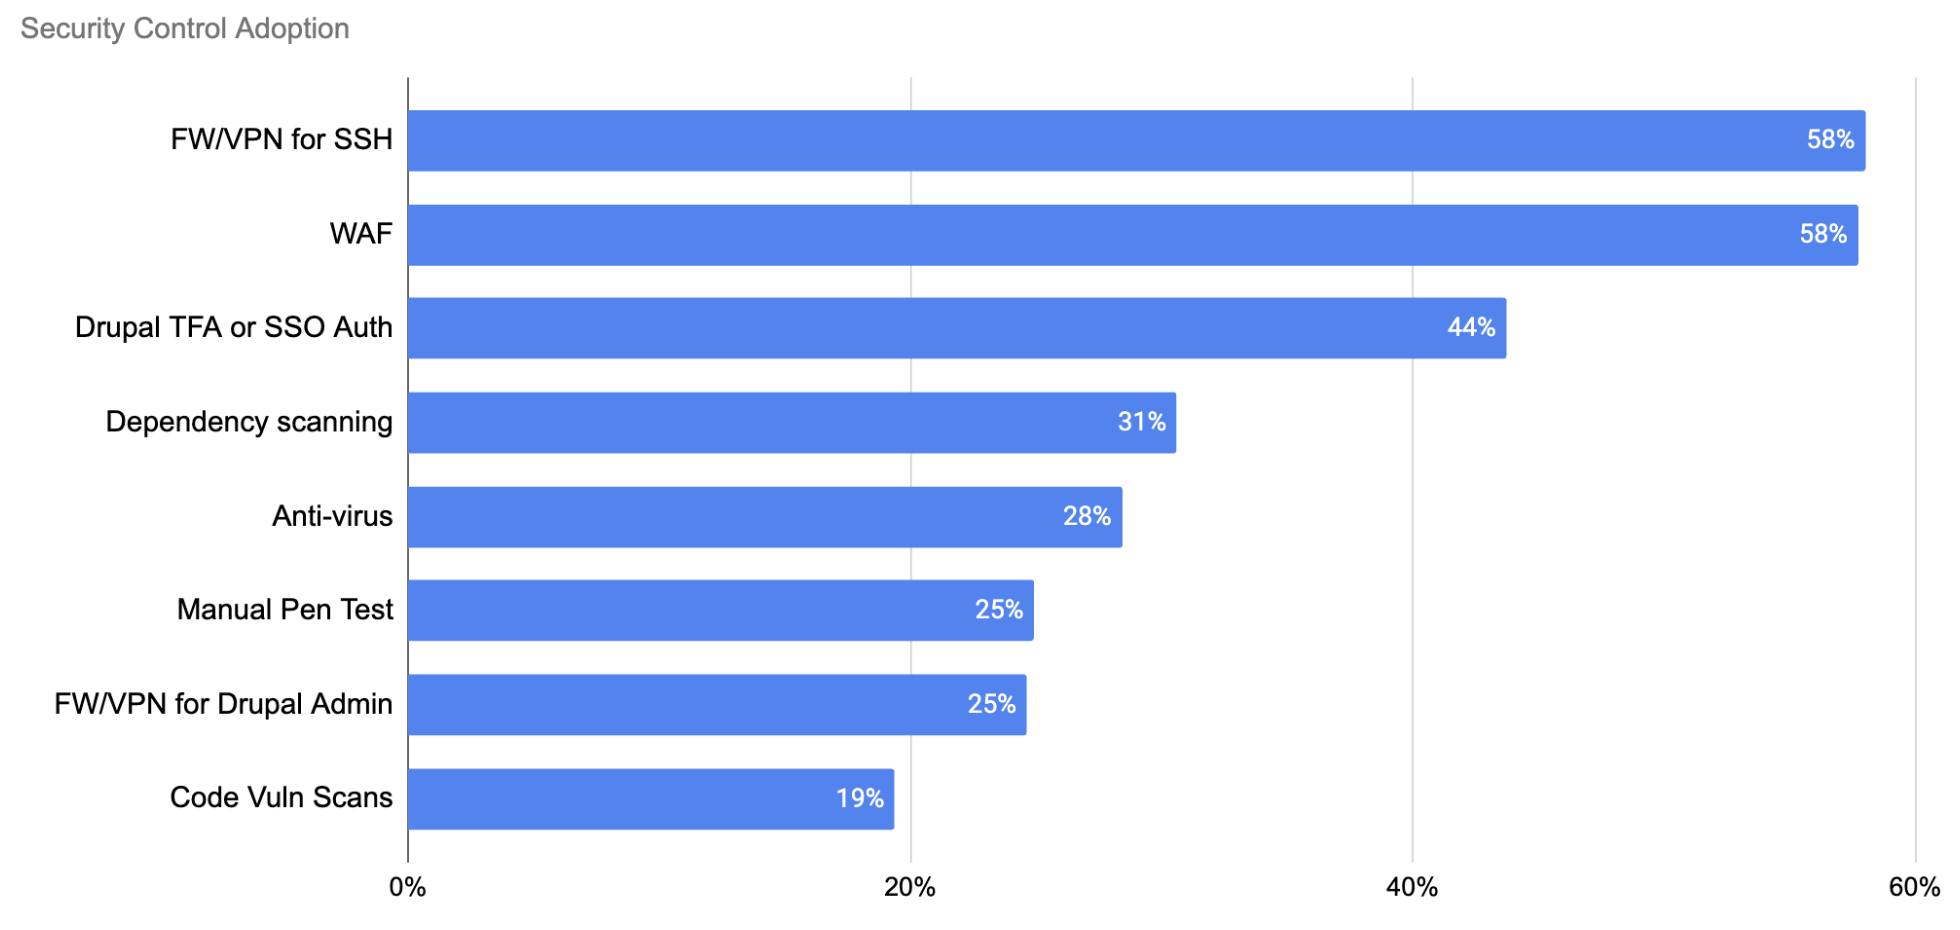
It was great to see that about 44% of respondents are using some form of advanced authentication controls for Drupal, either in the form of two-factor authentication or single sign-on. We would love to see that value increase next year.
Next year we’ll expand this to ask about more advanced controls like workstation security, since we’re seeing more attacks which take place through insecure workstations. But, clearly, we can do more as a community to encourage the adoption of even basic security controls.
If you’re interested, my talk at DrupalCon Prague last year about how non-technical decision makers can ask the right questions about security is available to watch on the @DrupalAssociation Youtube channel. I discussed a lot of these controls and their difficulty or ease in implementation and the return on investment.
Web Servers
Finally, a quick look at web server popularity. This is similar to the way IDEs broke down, with two vendors having nearly complete market share.
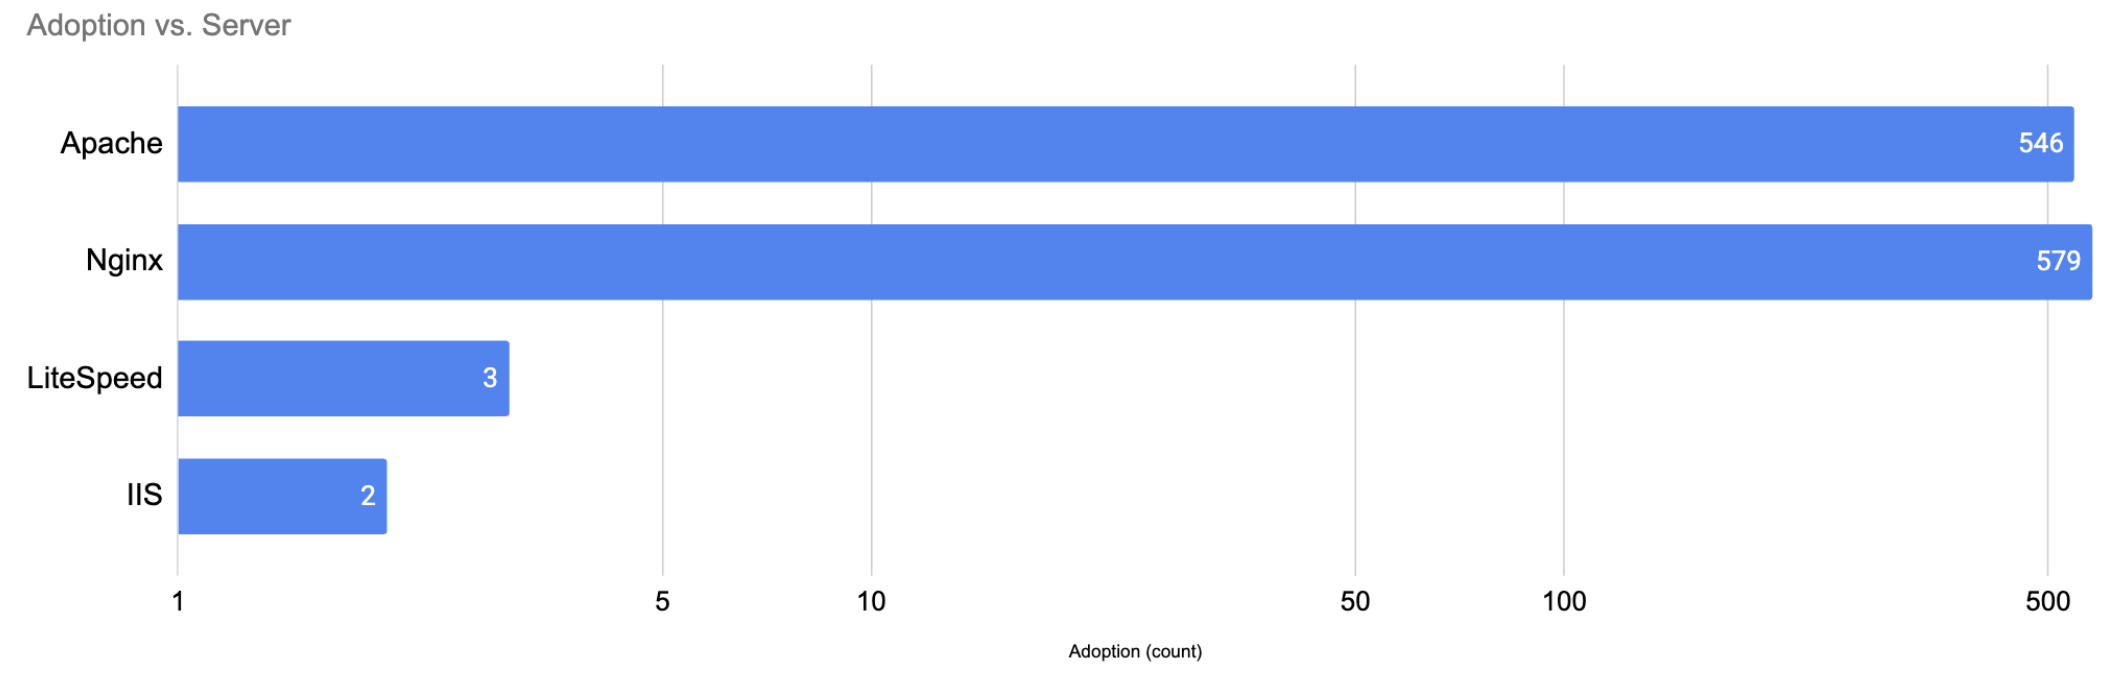
I thought it was interesting that there are still a few diehard IIS users out there, but I was also surprised to see so few LiteSpeed users on there.
Perhaps most interestingly, is how Nginx has overtaken Apache as the main web server for Drupal sites.
Closing Remarks
We had a tremendous amount of fun putting together this years local dev survey, and we hope you've found the results as interesting as we have. Thank you once again to everyone who took part this year.
Next year, we'll be sending the survey out again in April, and will release the results in time for DrupalCon Portland 2024. If you would like to be notified when the survey becomes available, and when results are published, you can follow us on Twitter or LinkedIn. Until next year!